Synthesis of Zinc Oxide Nanoparticles
Procedure modified by A. Jacobs and G. Lisensky from that of P. S. Hale, L. M. Maddox, J. G. Shapter, N. H. Voelcker, M. J. Ford, and E. R. Waclawik, "Growth Kinetics and Modeling of ZnO Nanoparticles," J. Chem. Educ. (2005) 82, 775-778.
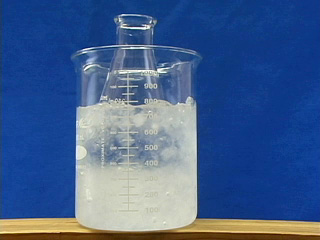
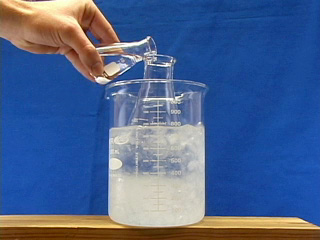
Zinc oxide quantum dot nanoparticles absorb UV light but are optically transparent making them useful as the active ingredient of sunscreens. The absorption wavelength is a function of particle size when the particles are small. This synthesis involves particle growth at 65°C; samples removed at longer times give larger particles. The cut-off wavelength from the absorption spectra can be used to estimate the particle size.
| Procedure | Wear eye protection |
Chemical gloves recommended |
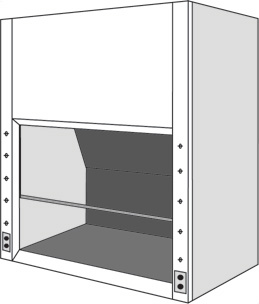 Fumehood recommended |

Calculations
Extrapolate the linear portions of the lowest energy absorbance as a function of wavelength to find the band edge wavelength for your sample.
(One option is to use the band edge tab on the Beers Law template. Change the wavelength values in the colored shaded boxes to choose the ends of the linear portions of your absorbance graph. The program will least squares fit the interval and show the intersection of the two lines in the table. The other option is to transfer the wavelength and absorption data to the band edge spreadsheet and do the same analysis.)
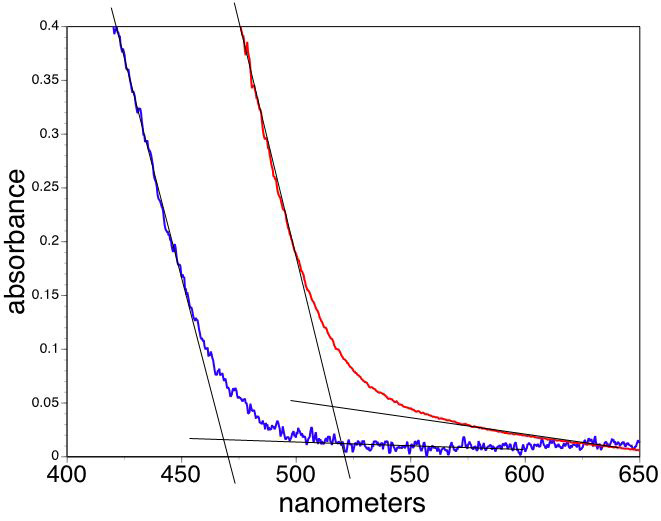 Finding the band edge for a semiconductor.
Convert the band edge wavelengths to band gap energies, Egnano and Egbulk.
Eg = h c / λ
h = 6.626x10⁻³⁴ J s
c = 2.998x10⁸ m/s
e = 1.602x10⁻¹⁹ C
ε0 = 8.854x10⁻¹² C2/N/m2
m0 = 9.110x10⁻³¹ kg
CdS
λbulk = 512 nm
ε = 5.7
me* = 0.19
mh* = 0.80
CdSe
λbulk = 709 nm
ε = 10.6
me* = 0.13
mh* = 0.45
ZnO
λbulk = 365 nm
ε = 8.66
me* = 0.24
mh* = 0.59
CuInS2
λbulk = 810 nm
ε = 11
me* = 0.16
mh* = 1.3
ZnS
λbulk = 340 nm
ε = 5.1
me* = 0.49
mh* = 0.28
PbS
λbulk = 3400 nm
ε = 17.2
me* = 0.25
mh* = 0.25
The effective mass model suggests
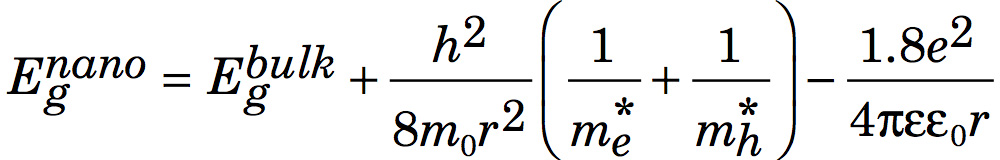
where r is the radius of the nanoparticle. The second term is the particle-in-a-box confinement energy for an electron-hole pair in a spherical quantum dot
and the third term is the Coulomb attraction between an electron and hole modified by the screening of charges by the crystal.
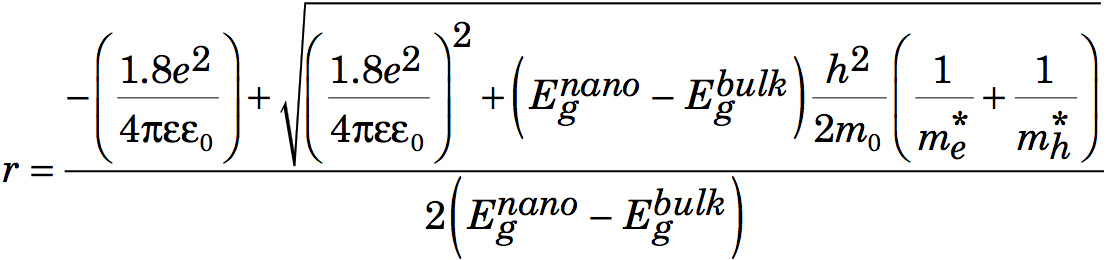
After multiplying by r2, rearranging, and using the quadratic formula to find r,
Conclusions
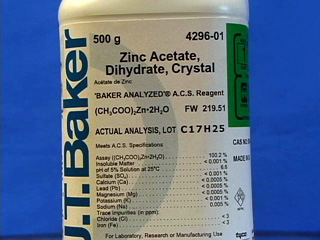
- Zn(CH3CO2)2.2H2O (0.10g per batch)
- Ethanol, CH3CH2OH, (165mL per batch) OR
- Isopropanol, (CH3)2CHOH (165mL per batch). Isopropanol vapors irritate the respiratory tract and eyes. Wear eye protection and use in a fume hood. Avoid skin contact. Alternatively we find using ethanol as the solvent gives similar results.
- ice
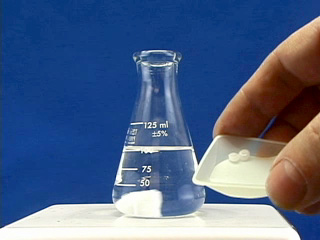
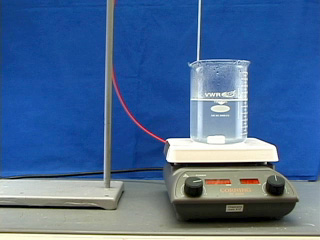
Dissolve 0.20 g NaOH in 100 mL alcohol with heating. (Quickly weigh out about 2 pellets of the hygroscopic NaOH and immediately transfer to the waiting solvent.) Chill the stock solution to prepare for use above.
Equipment
- 1L beakers for hot water bath and ice bath
- thermometer to measure 65°C
- Stirbars and stirring hotplate
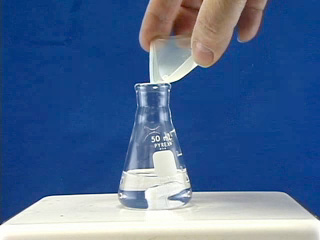
- 50 and 250 mL Erlenmeyer flasks
- 25 mL graduated cylinder
- 0.01 g balance
- UV spectrometer and cuvets
University of Wisconsin Materials Research Science and Engineering Center
Interdisciplinary Education Group | MRSEC on Nanostructured Interfaces
This page created by George Lisensky, Beloit College. Last modified March 26, 2017.