Making graphs in Excel
Download directions for making graphs from scratch in Excel
(pdf file)
or
Download a template ((Right click or CTRL-click
on the link. Drag down to something like "Save Link Target as..."
or "Save this Link as..." or "Download Link to Disk" or
"Download Linked File As..." or "Saved Linked File to Desktop...".
Open the saved file in Excel.)
Excel 2010 or later should use the xlsm version and Excel 1997-2004 should use the xls version. Excel 2008 for Mac does not work with either version. Google Sheets and Apple Numbers also do not work.
|
More than one set of data may be plotted on the same graph. Excel will give a macro warning because this sheet uses macros to make plots. Enable the macros to make the buttons work. | 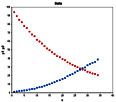 graph.xlsm or old graph.xls |
|
Linear least squares spreadsheet Plots data and fits a line to the data. Excel will give a macro warning because this sheet uses macros to make plots. Enable the macros to make the buttons work. | 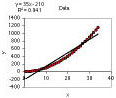 linear.xlsm or old linear.xls |
|
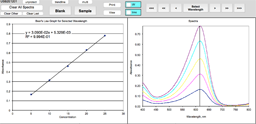
Determines unknown with standard deviation for calibration curve standards. Excel will give a macro warning because this sheet uses macros to make plots. Enable the macros to make the buttons work. | |
|
Histogram and averaging spreadsheet Plot data frequency that falls within a specified number of bins. Excel will give a macro warning because this sheet uses macros to make plots. Enable the macros to make the buttons work. | 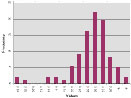 histogram.xlsm or old histogram.xls |
|
Titration spreadsheet (volts or pH) Plots titration data for the purpose of visually locating the endpoint. Excel will give a macro warning because this sheet uses macros to make plots. Enable the macros to make the buttons work. | |
|
Absorption titration spreadsheet Determines intersection of two lines from x-values in column A and y-values in columns B and C. Cut data from B to C to change which data point belongs to which line. Excel will give a macro warning because this sheet uses macros to make plots. Enable the macros to make the buttons work. | 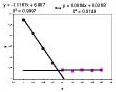 linear2.xlsm or old linear2.xls |
|
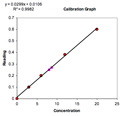
Determines unknown with statistics for calibration curve standards. Excel will give a macro warning because this sheet uses macros to make plots. Enable the macros to make the buttons work. | 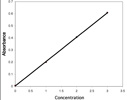 calibration.xlsm or old calibration.xls |
|
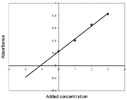
Determines x-intercept with statistics for standards added to a constant amount of sample. Excel will give a macro warning because this sheet uses macros to make plots. Enable the macros to make the buttons work. | |
|
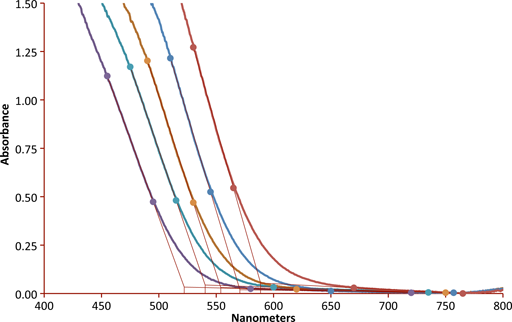
Extrapolates the user-selected linear portions of the absorbance as a function of wavelength to find the band edge. Excel will give a macro warning because this sheet uses macros to make plots. Enable the macros to make the buttons work. | |
|
Spreadsheet to take data from Ocean Optics USB 2000 using Windows XP or Windows 7. Analysis will work wth other operating systems. Excel will give a macro warning because this sheet uses macros to make plots. Enable the macros to make the buttons work. |