Hydrothermal Growth of ZnO Nanorods
Procedure modified by E. Koenig, A. Jacobs, and G. Lisensky from that of Lionel Vayssieres, Karin Keis, Sten-Eric Lindquist, and Anders Hagfeldt, "Purpose-Built Anisotropic Metal Oxide Material: 3D Highly Oriented Microrod Array of ZnO," J. Phys. Chem. B. (2001) 105, 3350-3352. See also "The kinetics of the hydrothermal growth of ZnO nanostructures," Thin Solid Films (2007) 515, 8679–8683.
Oriented zinc oxide hexagonal rods are grown by aqueous thermal decomposition of hexamethylenetetramine serving as a kinetic pH buffer,
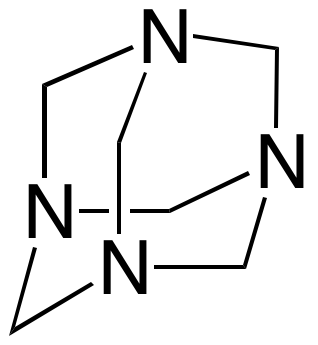 + 10 H2O → 6 H2CO + 4 NH4+ + 4 OH-,
ZnO is a semiconductor and these undoped materials are not very conductive. Shining UV light on ZnO excites electrons from the filled valence band to the empty conduction band where they can travel to the conductive FTO glass. Solution photoelectrochemistry (PEC) can demonstrate ZnO conduction in the presence of UV light.
The excited electron and/or its empty hole can also be used for photoremediation or treatment of wastewater. In this experiment methylene blue, a non-toxic dye that is not degraded by ultraviolet light in the absence of a catalyst, is used to simulate an organic pollutant in water. Absorbance spectroscopy can be used to measure the rate of methylene blue degradation.
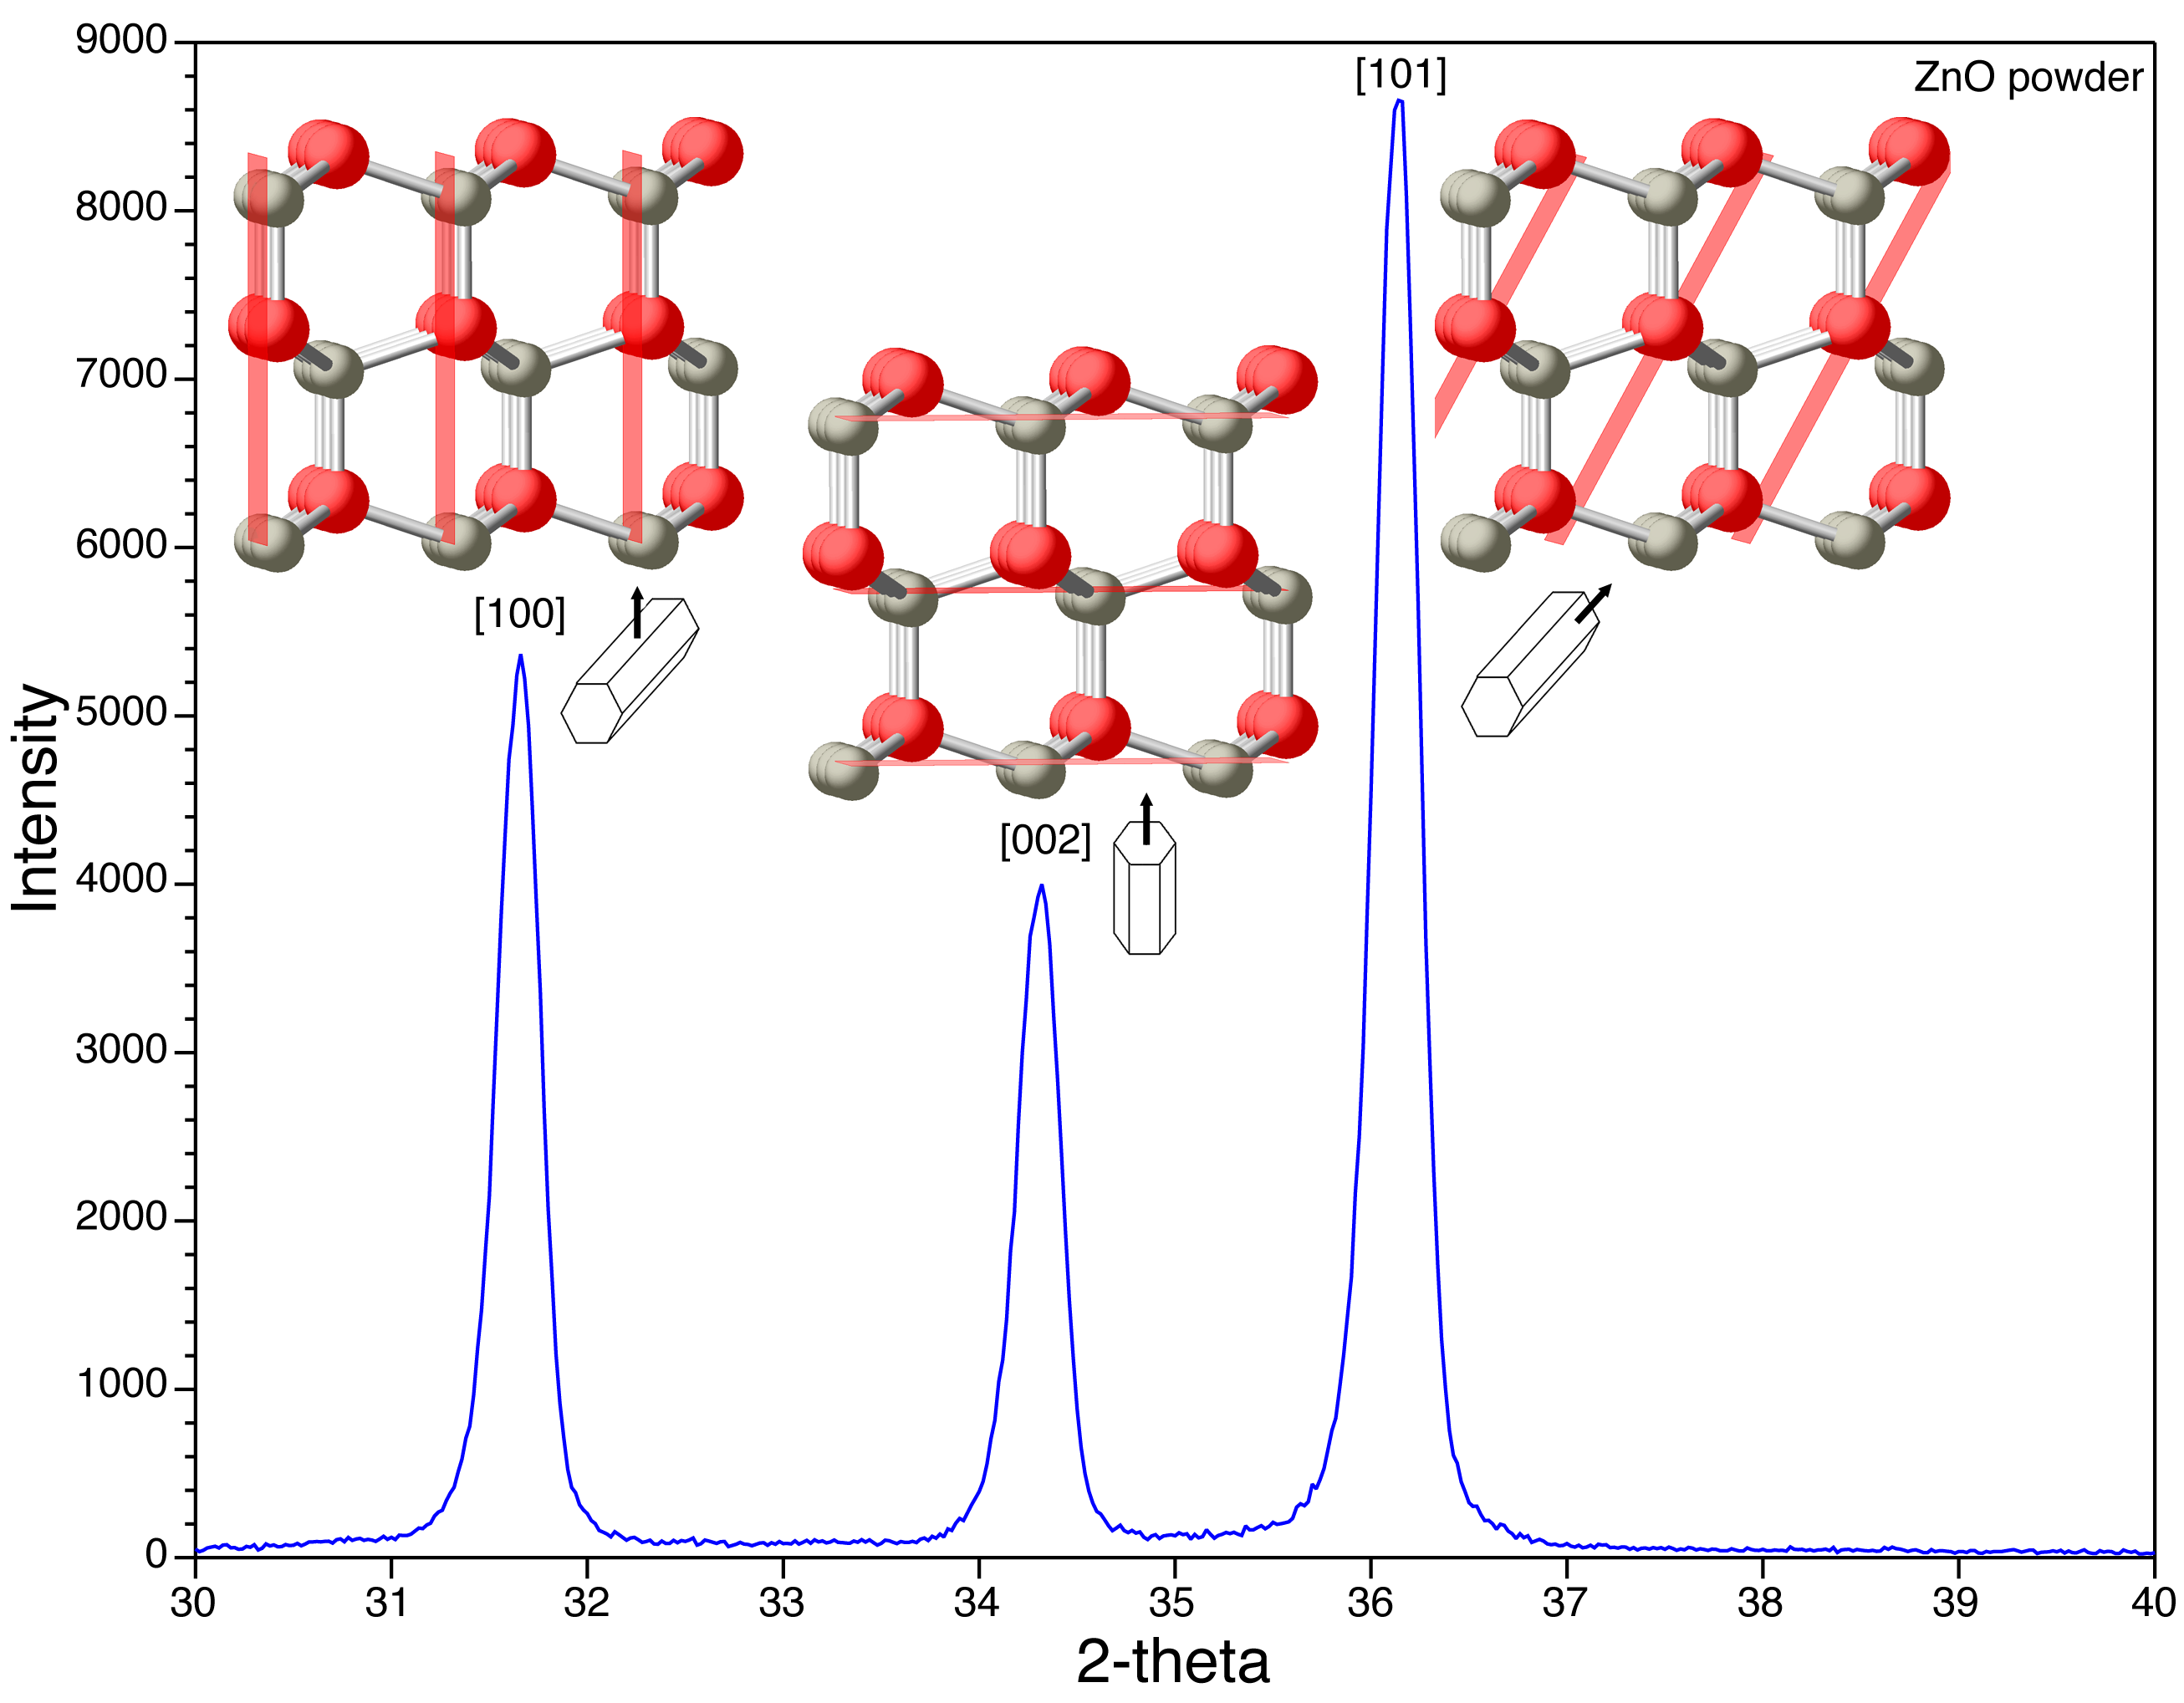
Orientation of the ZnO crystals can be measured by powder x-ray diffraction (XRD) in comparison with the XRD of randomly-oriented ZnO powder.
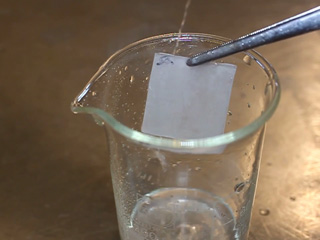
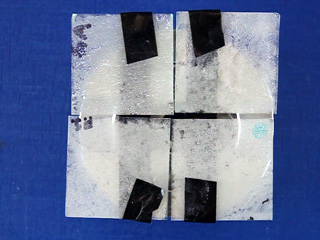
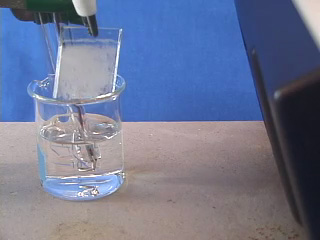
You will do the synthesis ahead of time, preparing two (hopefully identical) ZnO-coated FTO samples. To do the analysis in one lab period we will work in groups of four. One pair of students will do the SEM and PEC experiments on one sample and the other pair will do the absorption spectroscopy, XRD, and decolorization of methylene blue experiments on the matched sample. You will need the results from both pairs for your data and analysis in your notebook and to answer the report questions.

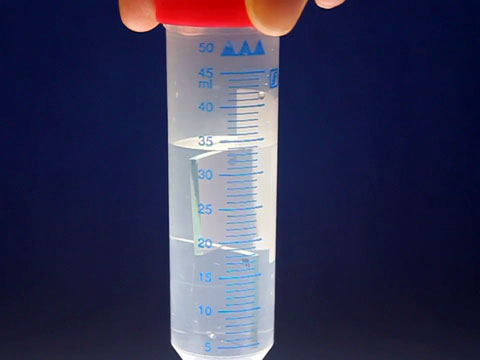
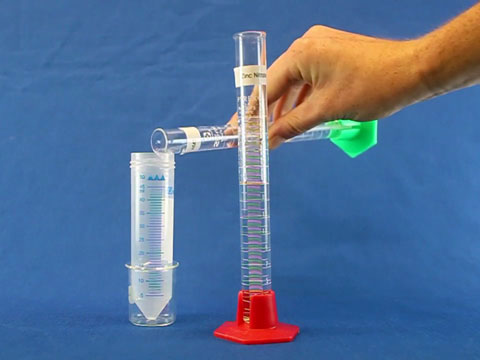 , to an autoclavable 50 mL polypropylene centrifuge tube. Mix well.
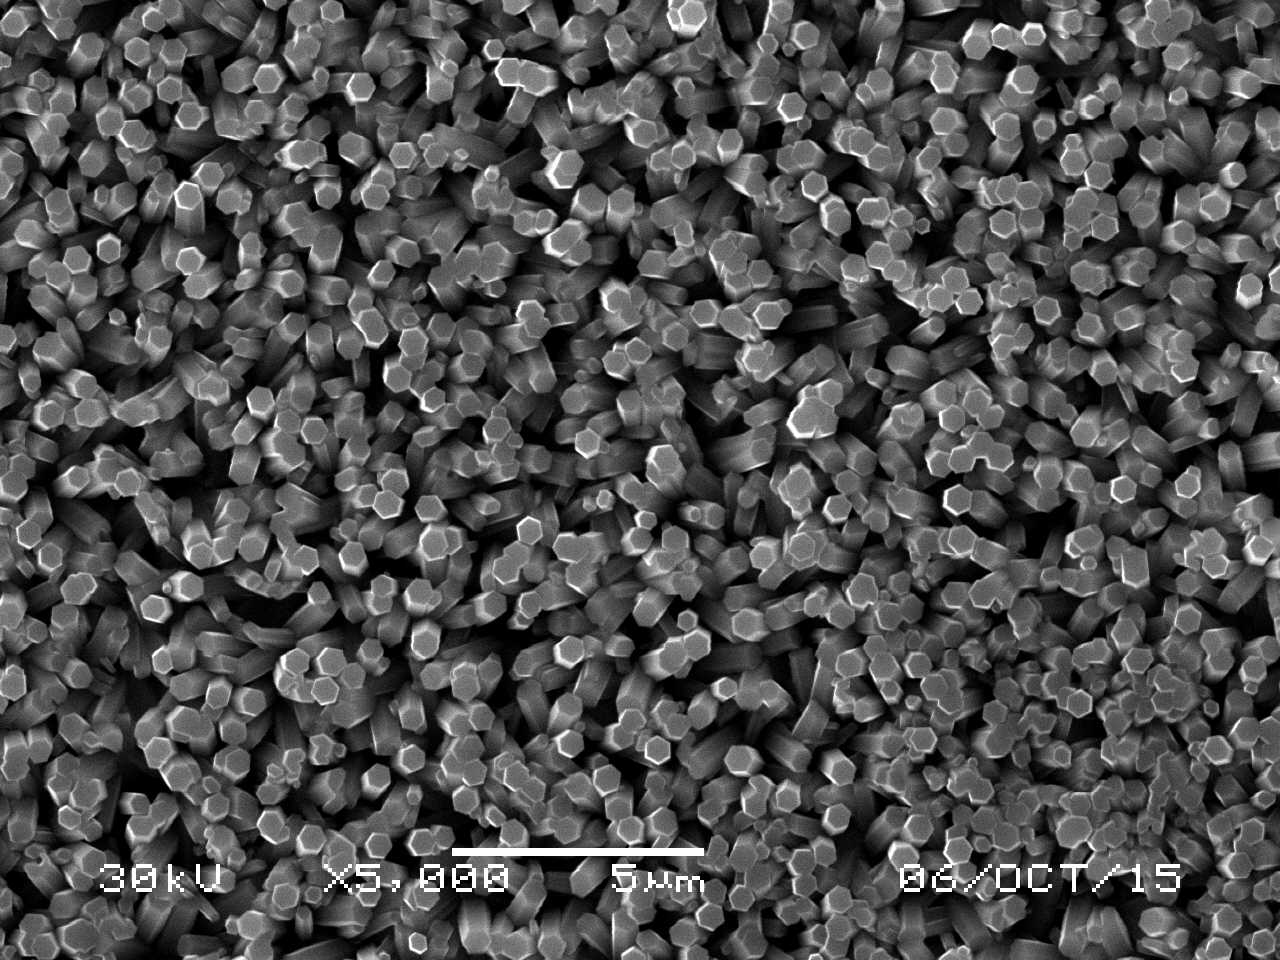 Click image for larger view
SEM of ZnO

 Click image for larger view
XRD of ZnO Powder
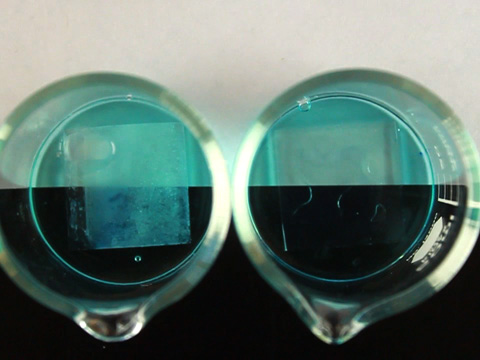
 Click image for larger view
Methylene blue
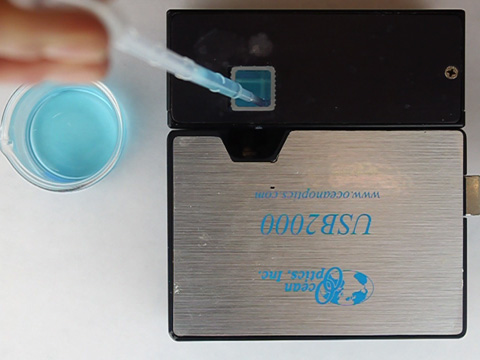
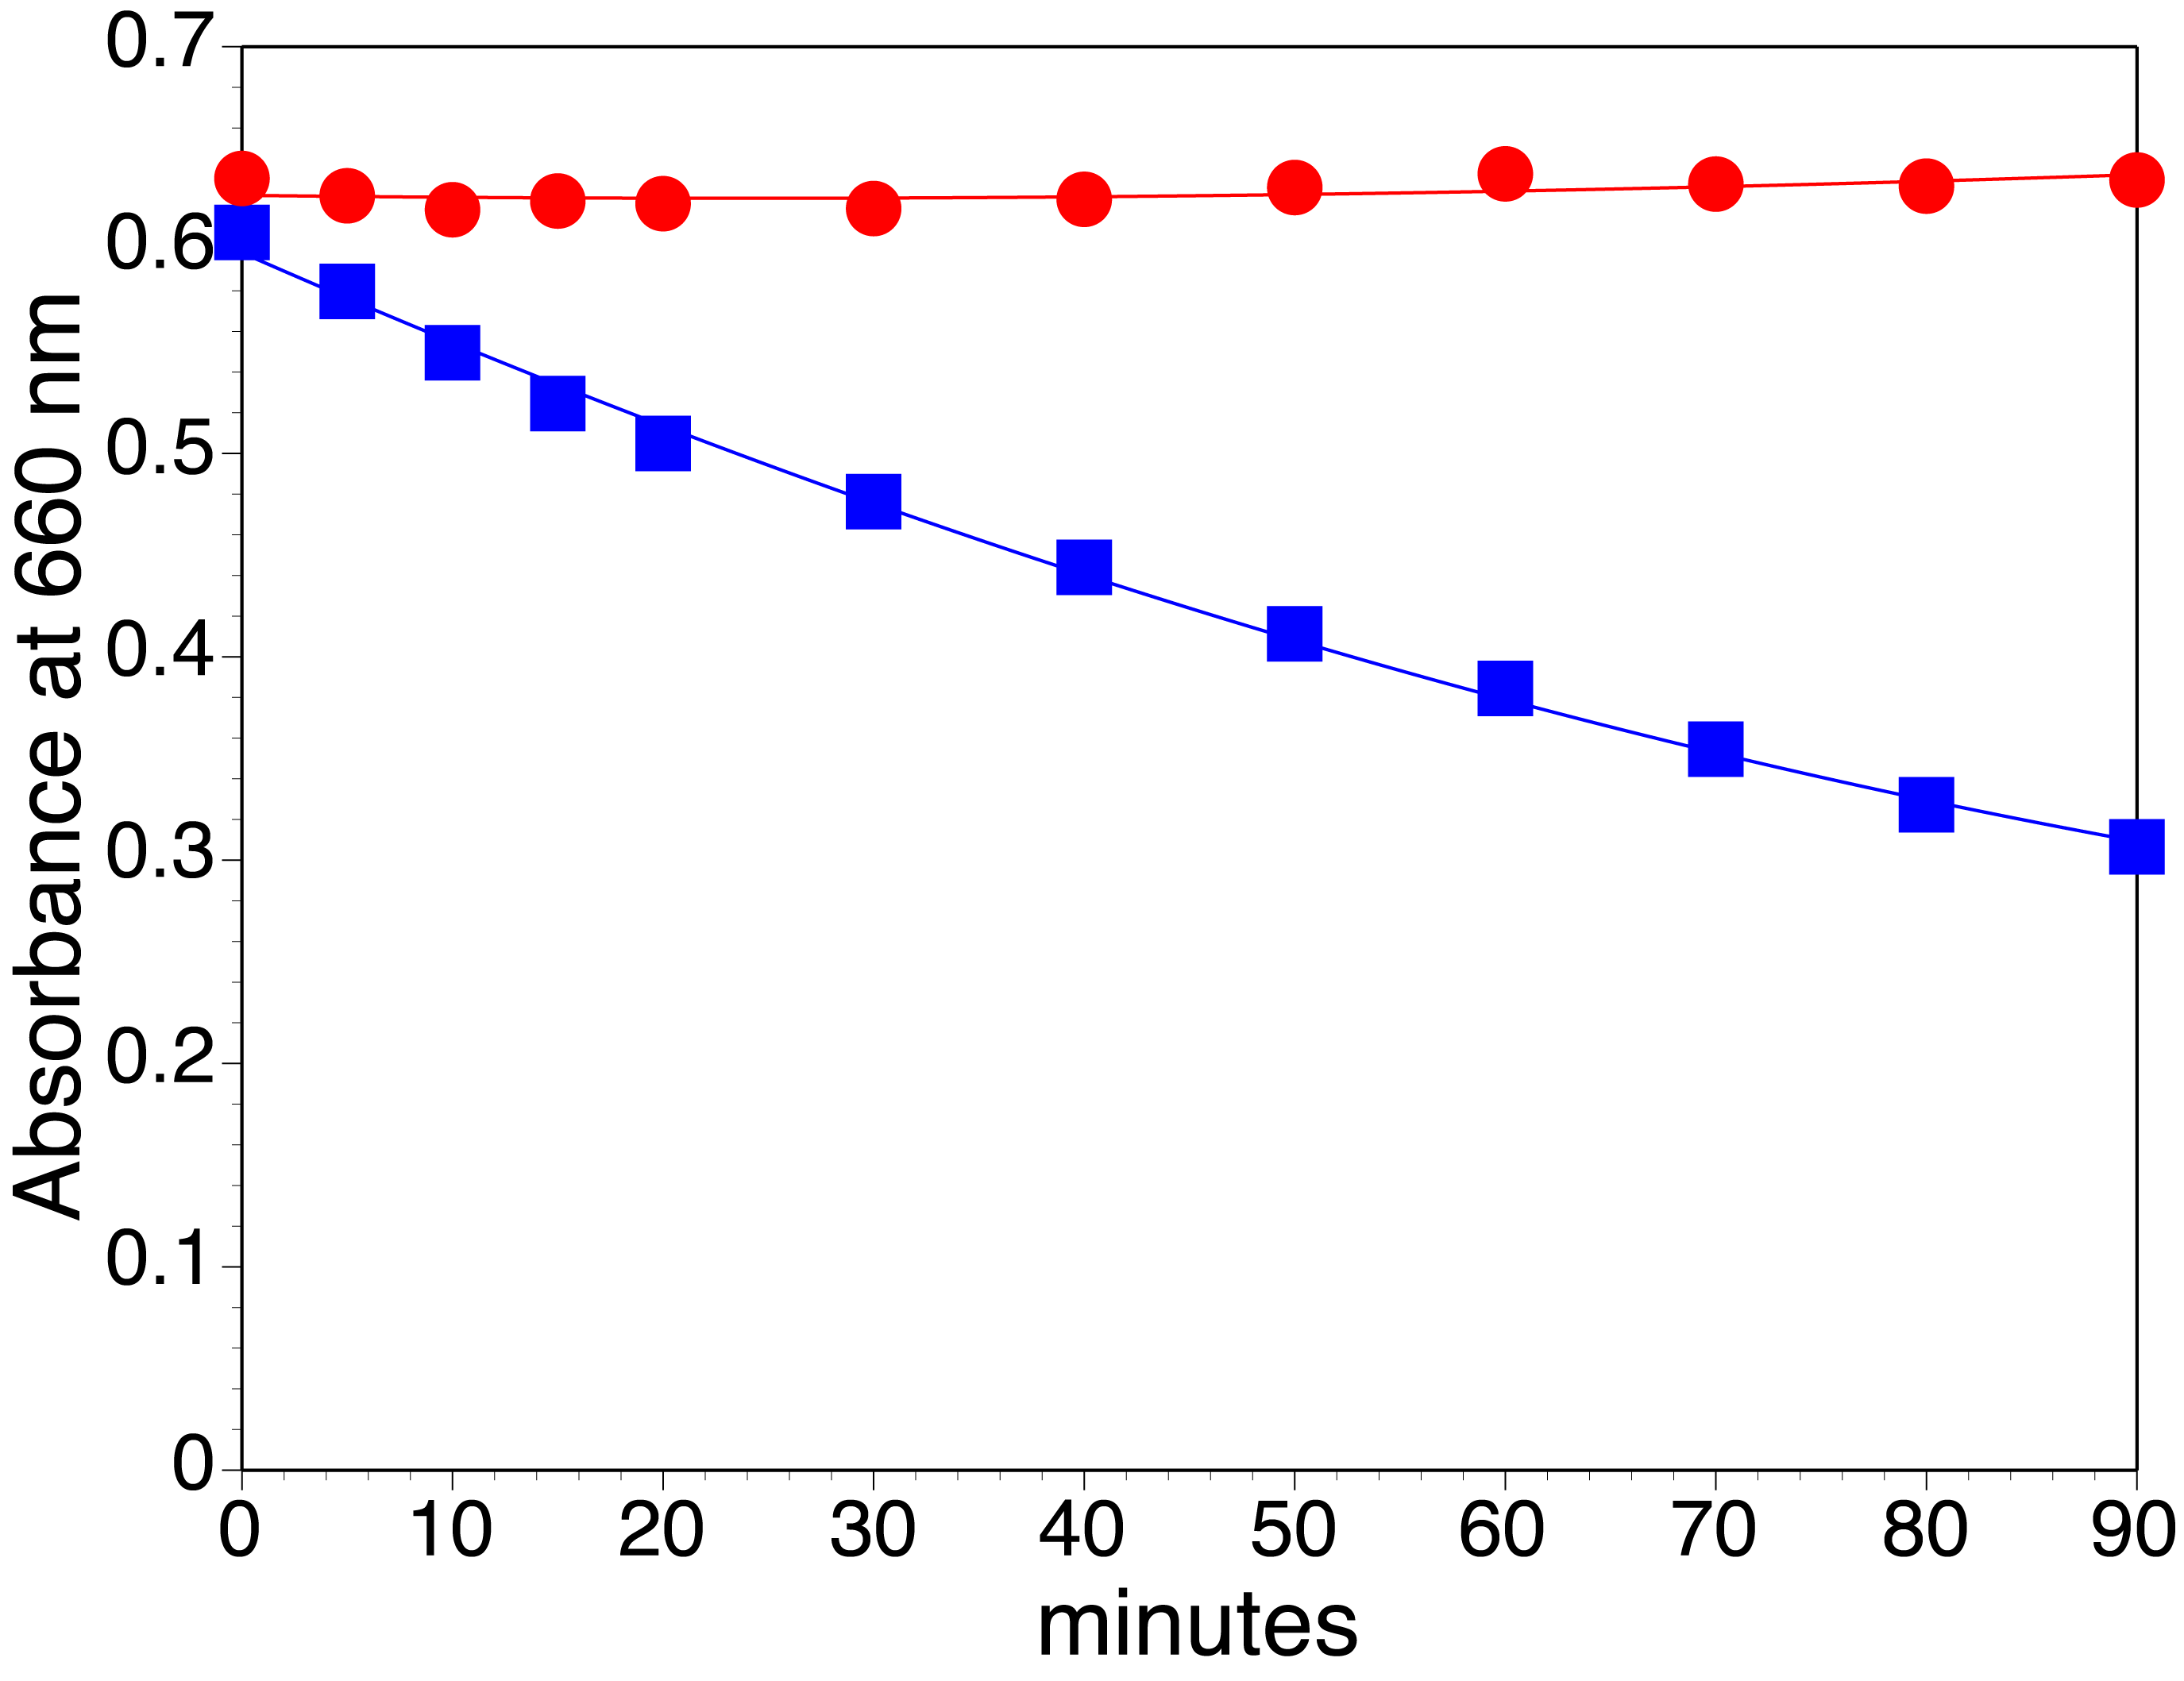 Click image for larger view
Absorbance vs. time
Methylene Blue Graph and Calculations
For a first-order degradation reaction the change in methylene blue concentration is proportional to the methylene blue concentration:
d[Abs]/dt = -k [Abs]. Integrating this expression gives [Abs] = [Abs]o exp(-k t). Taking the ln of the integrated equation gives a linear form, ln[Abs] = ln[Abs]o- k t. Plot ln[Abs] versus t to give a straight line with slope -k and find the half life, t1/2 = (ln 2)/k.
Spectra, Images and Graphs
Your notebook should include your group SEM images, the bulk electrolysis graph, the overlayed cyclic voltammetry graphs, visible/ultraviolet spectrum and analysis to find the band-gap, powder x-ray diffraction scans, and methylene blue spectra and ln[Abs] graph. It is not enough to just collect printouts. You should explain and do some analyzing and show what is being measured on every page.Conclusions (Groups A and B together)
- What evidence do you have for preferential growth along a particular crystal face?
- What is the wavelength for the band gap of your sample?
- While applying 0 V vs Ag/AgCl, by what factor did the current change in the presence of a UV light source? (Which UV light source did you use?)
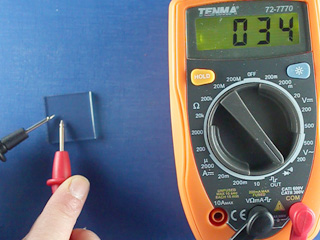
- What is the resistance of the sample with and without illumination? Hint: Fit a straight line to a portion of your cyclic voltammetry results and apply Ohm's Law. Show your calculations. (Which UV light source did you use?)
- Based on your measurements of the absorbance as a function of time, what is the rate constant and how long would it take to remove half the methylene blue using UV light?
- Summarize the evidence that ZnO is a semiconductor.
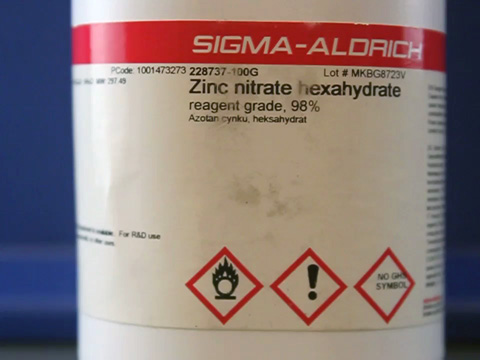
- 0.20 M Zn(NO3)2.6H2O, Aldrich 228737. Dissolve 5.76 g in 100 mL water.
- 0.20 M Hexamethylenetetramine, C6H12N4, Aldrich H11300 or 398160. Dissolve 2.93 g in 100 mL of water. Use within a few days.
- ZnO seed crystals prepared from Zn(CH3CO2)2.2H2O and NaOH in ethanol rather than isopropanol following the procedure from J. Chem. Educ. (2005) 82, 775-778 or Synthesis of ZnO Nanoparticles (See http://chemistry.beloit.edu/edetc/nanolab/ZnO). Prepared ethanol seed solutions kept in a freezer have been successfully used after storage for 2 years.
- 0.010 M KOH. Dissolve 0.56 g KOH in a liter of water.
- 10 µM methylene blue, Aldrich M9140. Dissolve 0.019 g in 250 mL water to make a stock solution, then dilute 5 mL of stock to 100 mL for the sample solution.
- 50 mL autoclavable polypropylene centrifuge tube (Sarstedt 62.547.254)
- 10 and 25 mL graduated cylinders
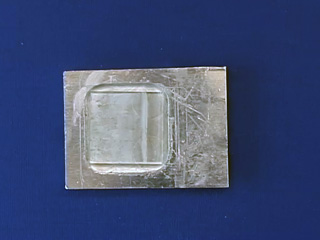
- FTO glass (1" x 1" x 2.3mm TEC 15 glass) from Hartford Glass Co, 735 E Water Street, Hartford City, IN 47348 Phone: 765-348-1282. The FTO glass can be reused after rinsing in HCl.
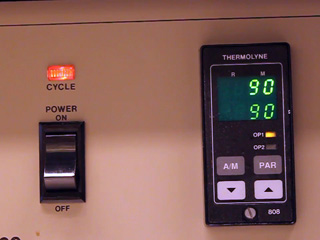
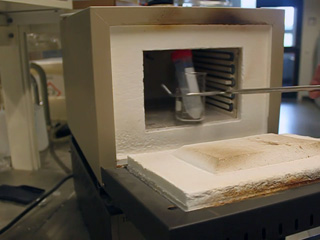
- 90°C oven
- SEM and XRD
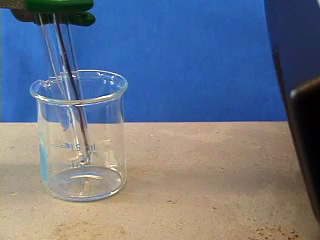
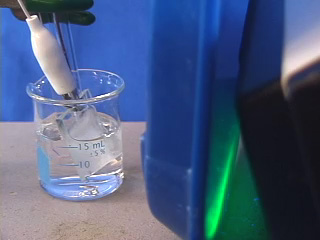
- Photoelectrochemical equipment (electrolysis instrumentation, Ag/AgCl reference electrodes, graphite electrodes, 30 mL beakers, UV light sources)
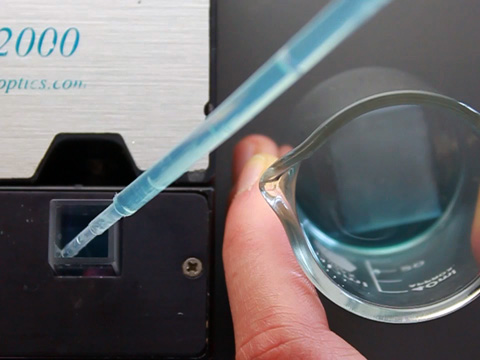
- Photodegradation equipment (visible absorbance spectrometer, 50 mL beakers, cuvets, plastic pipets for changing samples)
Connect the computer to the WaveNow Potentiostat using the USB cable. Connect the power cord to the potentiostat and turn it on.
Connect electrodes to the aligator clips coming from the WaveNow instrument. Be sure to keep the aligator clips out of the solution. The metal clips should not touch each other or any clamps.
- Red: Working Electrode (ZnO-coated FTO glass).
- Green: Auxiliary Electrode (graphite rod).
- White: Reference Electrode (Ag/AgCl).
- The orange lead should be plugged into the red banana plug.
Run the AfterMath software.
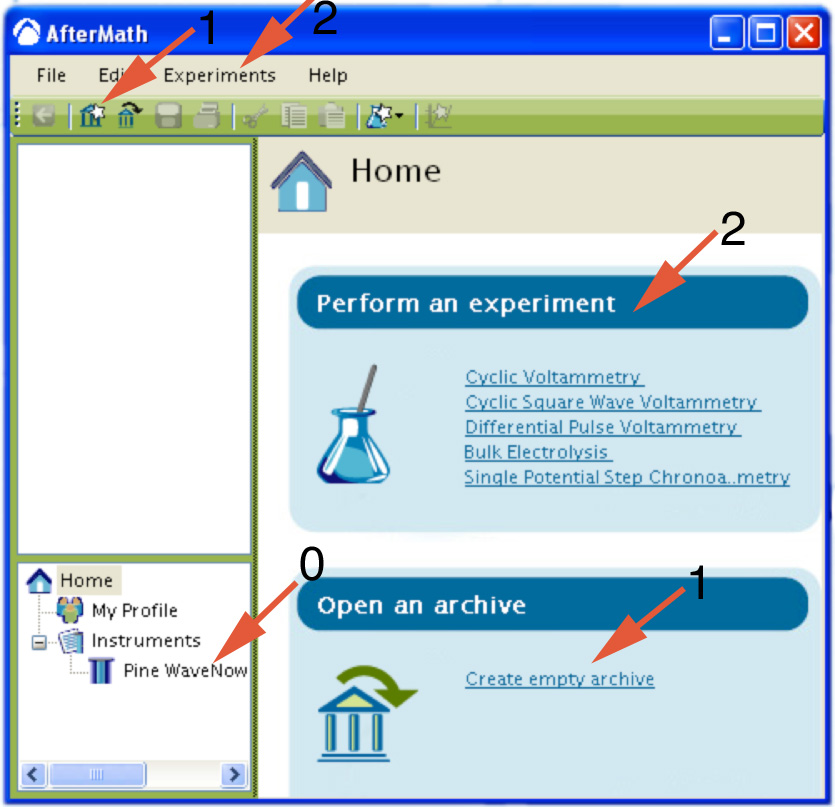
- Wait for the potentiostat to appear in the AfterMath Instrument List (0).
- Create an empty archive to store your data (1).
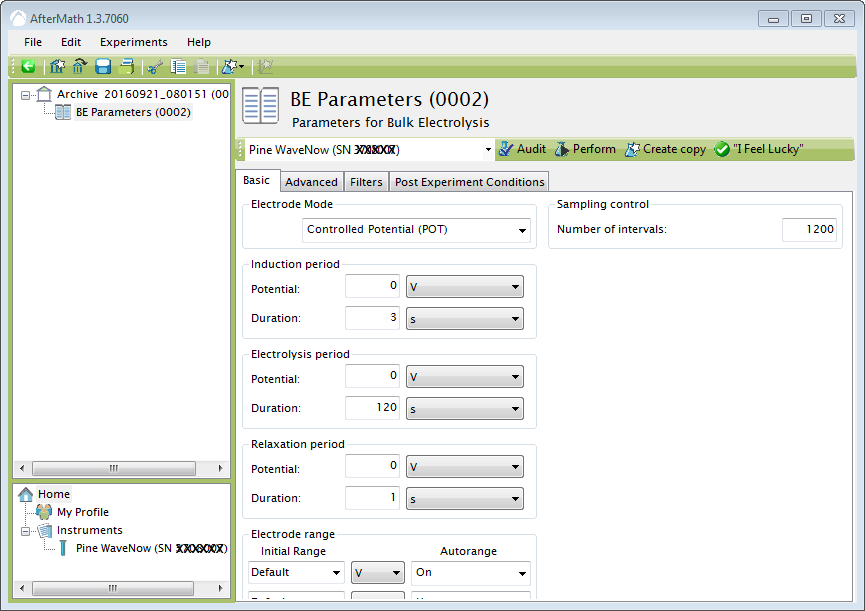
- For the first part choose the Bulk Electrolysis method from the Perform an experiment list or from the Experiments menu. (2)
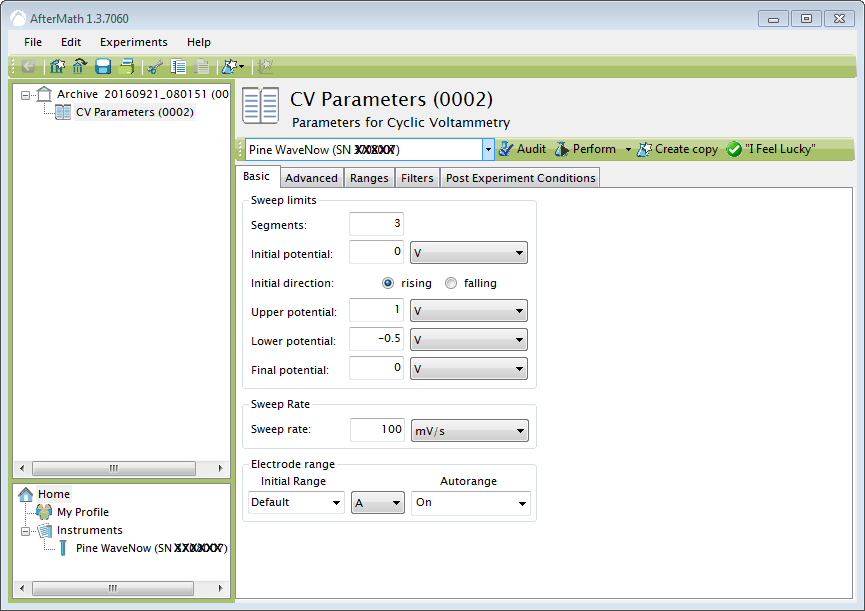
- For the second part choose the Cyclic Voltammetry method from the Perform an experiment list or from the Experiments menu. (2)
For bulk electrolysis, set electrolysis potential 0V, duration 120s, and number of intervals 1200.
For cyclic voltammetry, use 3 segments from 0 V to 1 V (rising direction) to -0.5 V to 0 V at 100 mV/sec.
Click on the perform button. (If the button is gray, make sure that the basic parameters are filled in and that an instrument has been selected.) The current will be plotted as a function of applied voltage and the results are placed in the archive. Click on CV Parameters in the Archive to run again or make changes.
To overlay scans for cyclic voltammetry, right-click on the name of the archive and select new plot. Then copy-and-paste "current vs potential" under "voltammogram" onto the plot for each of the scans to be overlayed.
University of Wisconsin Materials Research Science and Engineering Center
Interdisciplinary Education Group | MRSEC on Nanostructured Interfaces
This page created by George Lisensky, Beloit College. Last modified March 31, 2020 .