These are wavelength plots. Energy increases
towards the left.
Log of emission is plotted (each unit is a tenfold change in emission
intensity.)
The curves for the visible portion of the spectrum are colored
with the approximate color for each wavelength.
The observed color depends on the sum of the colors and their
intensity. See color mixing.
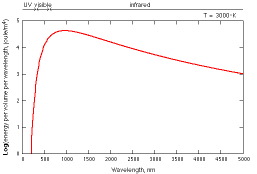 Log of blackbody emission from 400 to 3000 K.
|
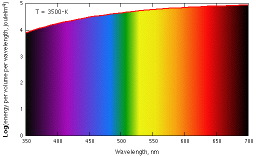 Visible portion of log of blackbody emission from
1200 to 3500 K.
Visible portion of log of blackbody emission from
1200 to 3500 K.
|
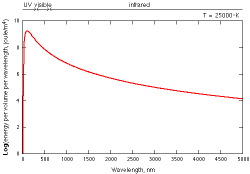 Log of blackbody emission from 250 to 25,000 K.
|
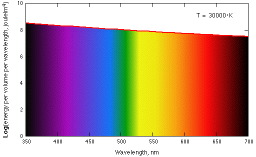 Visible portion of log of blackbody emission from
1000 to 30,000 K.
Visible portion of log of blackbody emission from
1000 to 30,000 K.
|