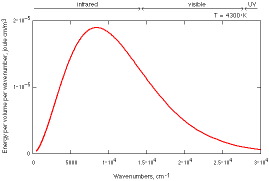
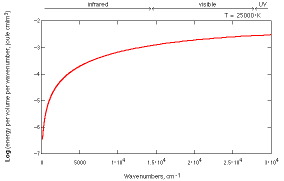
These are frequency plots. Energy increases towards the right.
For the Log(emission) plot each unit is a tenfold change in emission intensity.
Blackbody emission from 1200 to 4300 K.
Log of blackbody emission from 1400 to 25000 K.
Switch to
wavelength plots
. Switch to
log(emission) wavelength plots
.
Blackbody Radiation |
Build a Better CD Player
|
ChemConnections