Periodic Properties of CH3NH3Pb(I1‑xBrx)3 Solid Solution Perovskite Semiconductors
Procedure modified by Fabian Dauzvardis, Megan Young and George Lisensky, Beloit College, from "Chemical Management for Colorful, Efficient, and Stable Inorganic-Organic Hybrid Nanostructured Solar Cells", J. H. Noh, S. H. Im, J. H. Heo, T. N. Mandal, and S. I. Seok, Nano Lett. 2013, 13, 1764-1769.
For solid solutions with the same arrangement of atoms, the size of a unit cell depends on the size of the atoms in the unit cell. Consider samples of the CH3NH3Pb(I1‑xBrx)3 semiconductor. Since I- and Br- are different sizes, changing the value of x between 0 and 1 should change the unit cell size. Since the distance between nuclei helps determine how strongly electrons are held, changing the value of x should also change the band gap energy. In this experiment you will study CH3NH3Pb(I1‑xBrx)3 for an assigned value of x, measure the unit cell size by powder x-ray diffraction, and estimate the band gap energy by visible absorption spectroscopy. Combining class values will let us see the overall relationship between composition, atomic size, and electron energy levels.
Caution: these samples contain lead. Care should be taken not to accidentally ingest them. Clean up all spills. Dispose of the material in an appropriate waste container.
| Procedure | Wear eye protection |
Chemical gloves required |
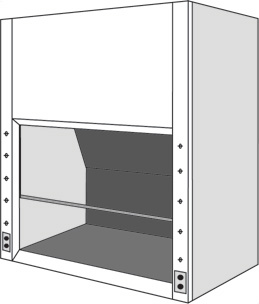 Fumehood required Fumehood required |
Synthesis and Powder X-ray Diffraction (XRD)
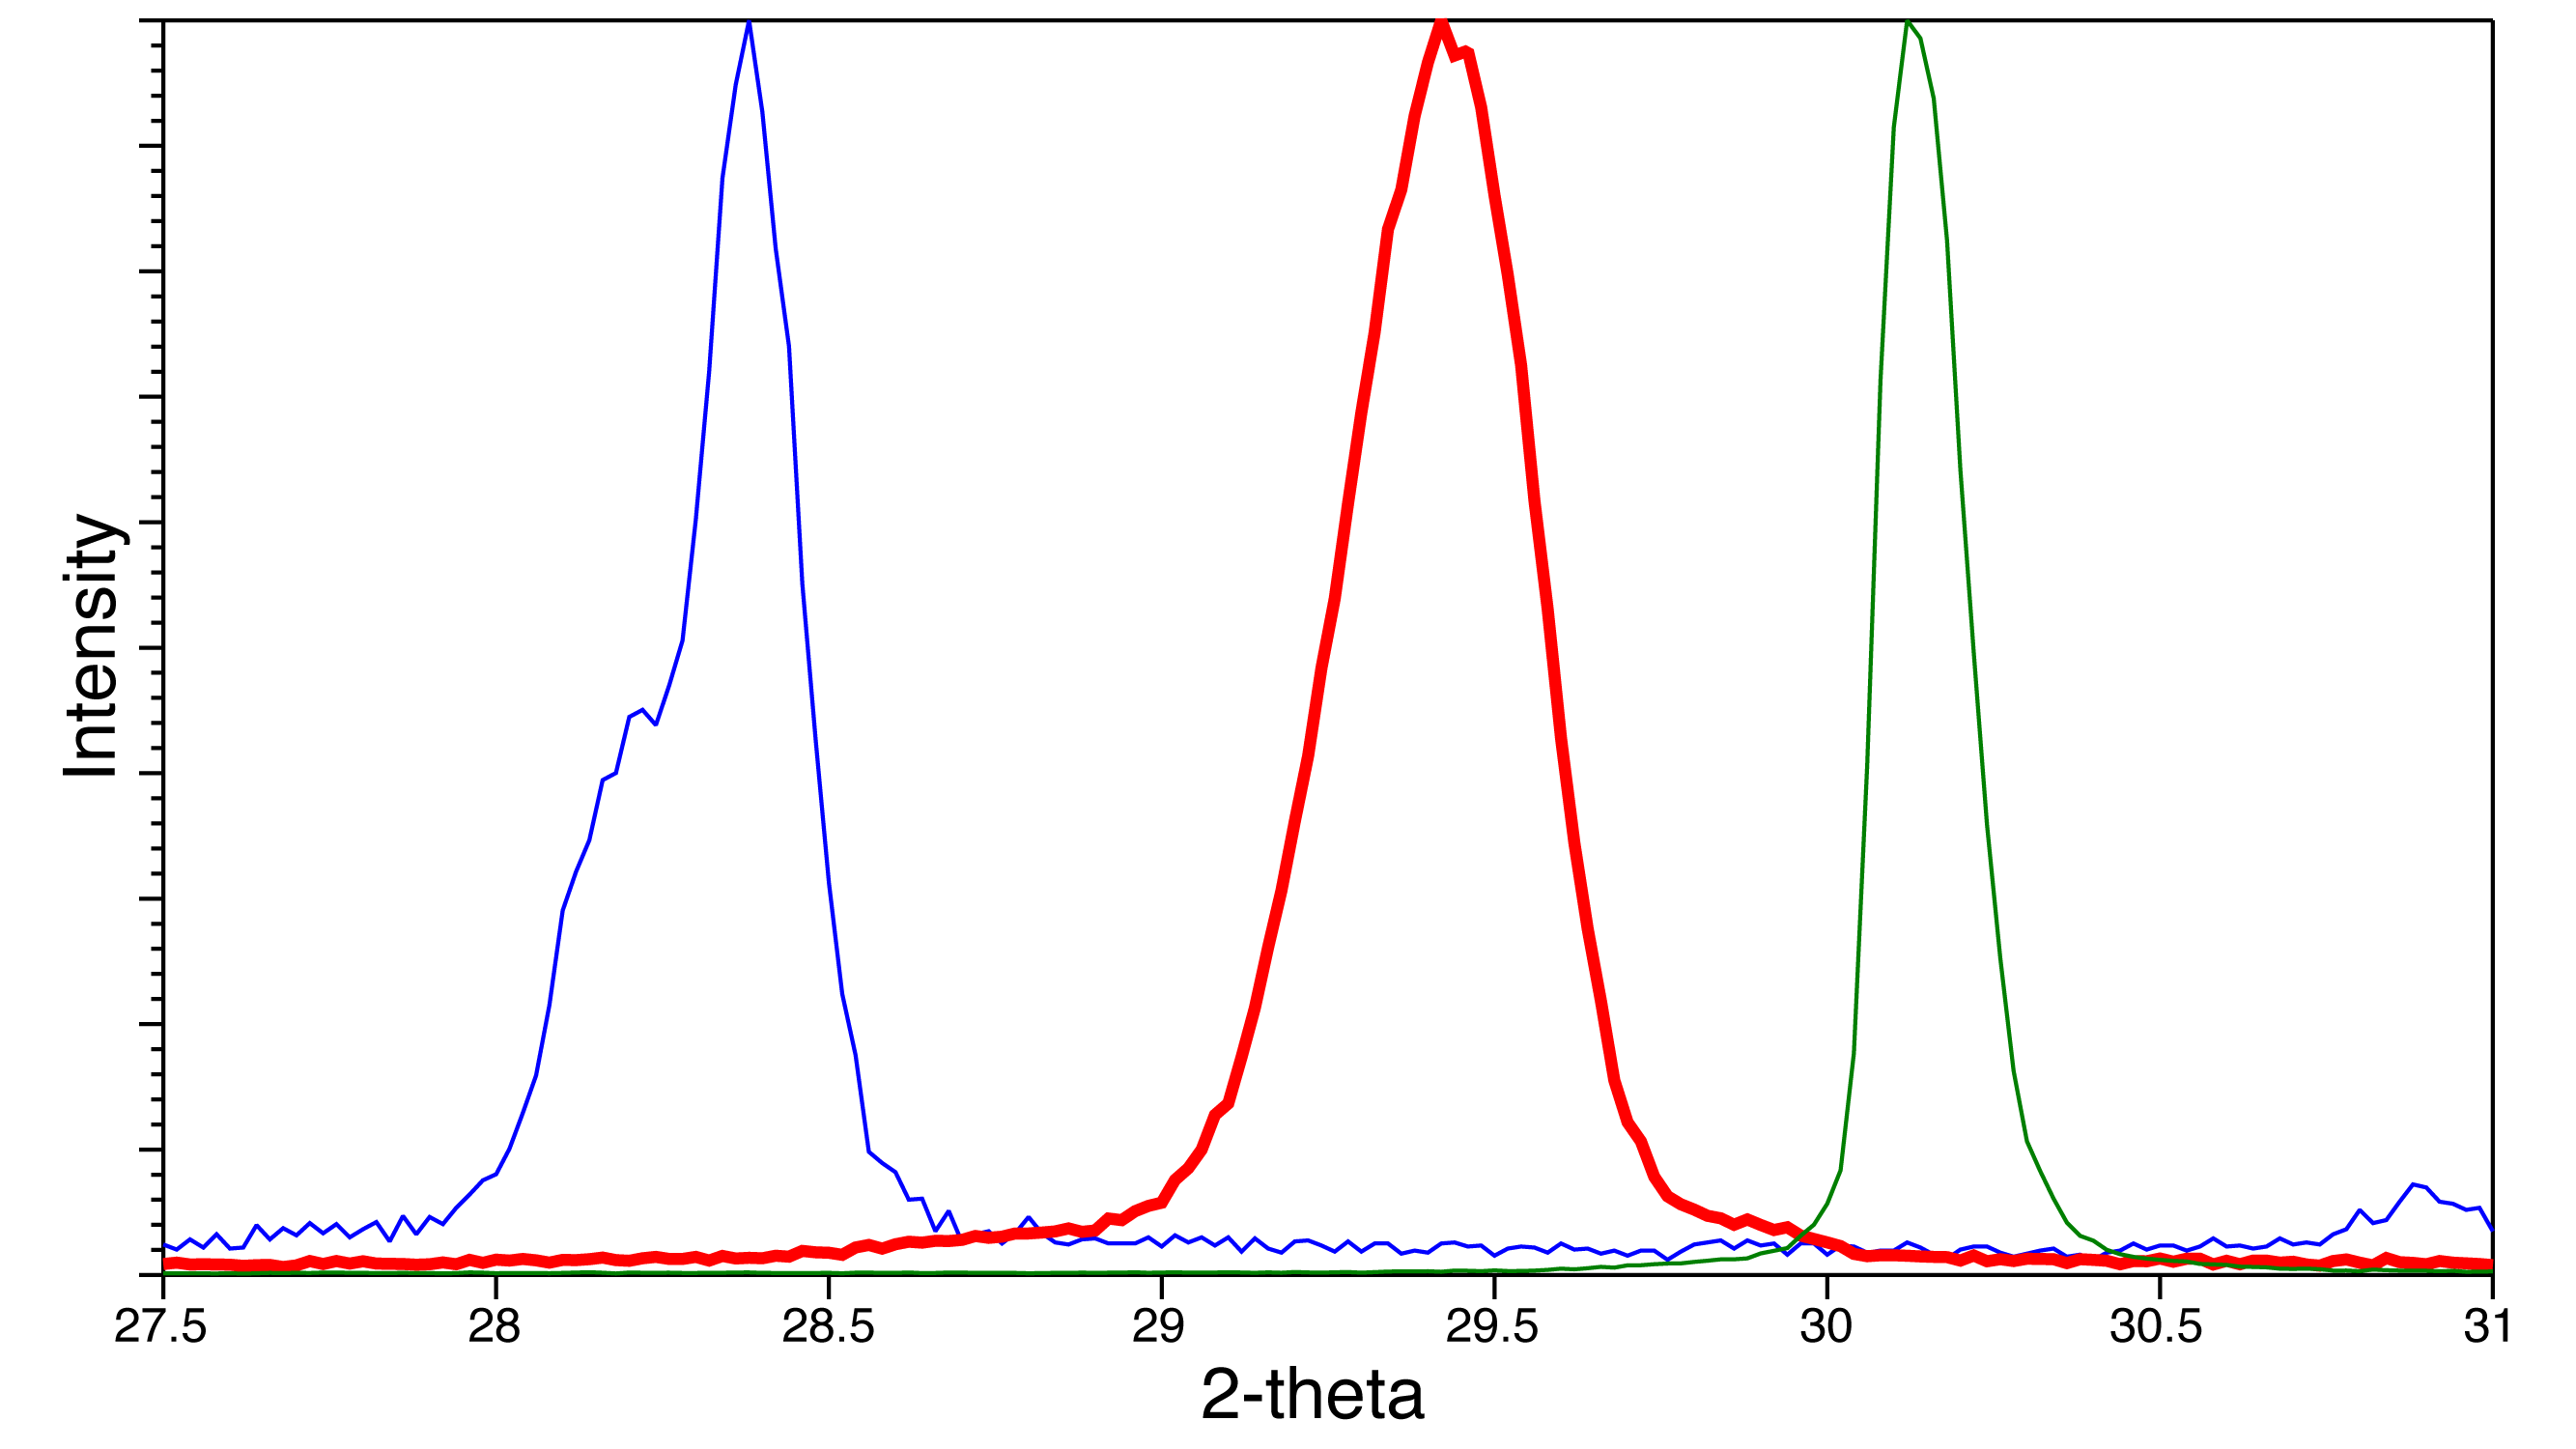 XRD patterns for 3 samples
 Double the d-spacing to get the unit cell size (this is the 200 peak.)
(The crystal structure of CH3NH3PbI3 has lower symmetry than the crystal structure of CH3NH3PbBr3 but can be analyzed as a pseudocubic unit cell.) If a shoulder is apparent in the XRD of the solid solutions, reheat the sample and obtain the XRD pattern again. The figure shows the XRD change upon additional heating (thick line) for a phase-separated sample.
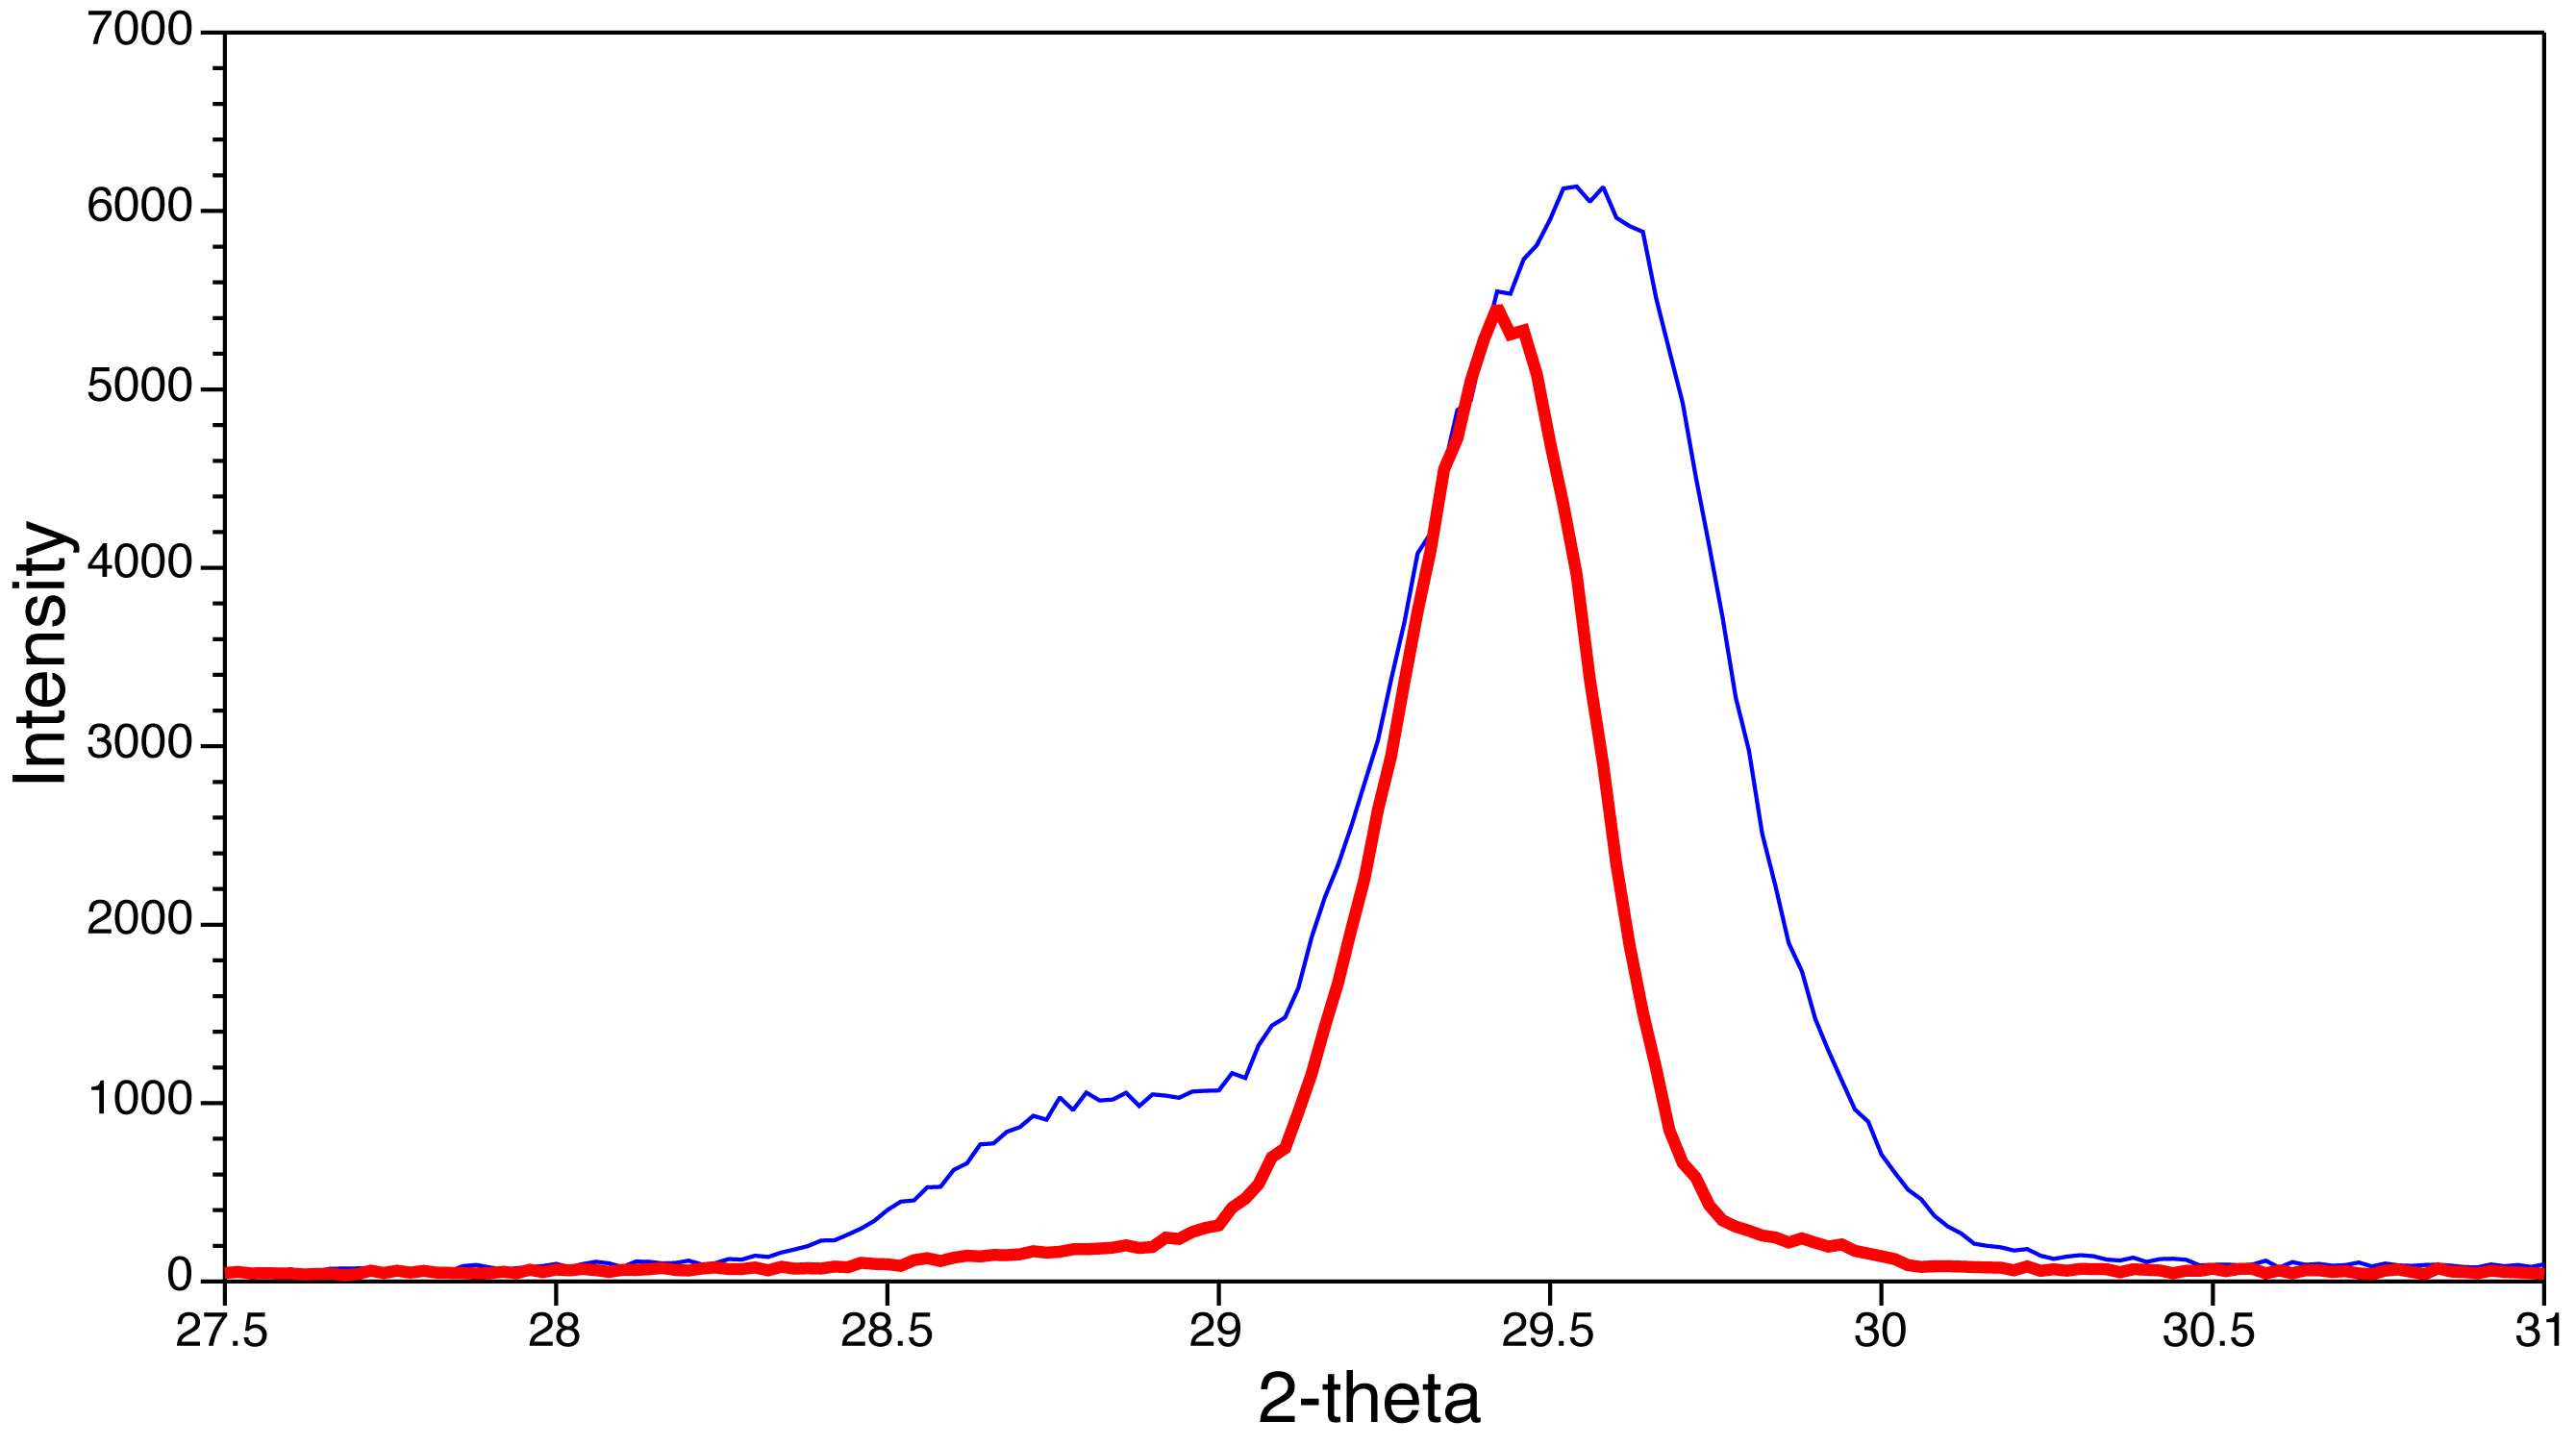 Change in XRD with heating
Synthesis and Visible Spectroscopy
Extrapolate the two linear portions of the visible spectra to find their intersection. This wavelength corresponds to the minimum energy needed to excite an electron from the conductance band to the valence band which is called the band gap energy, E=hc/λ. If two steps are observed, reheat the sample.
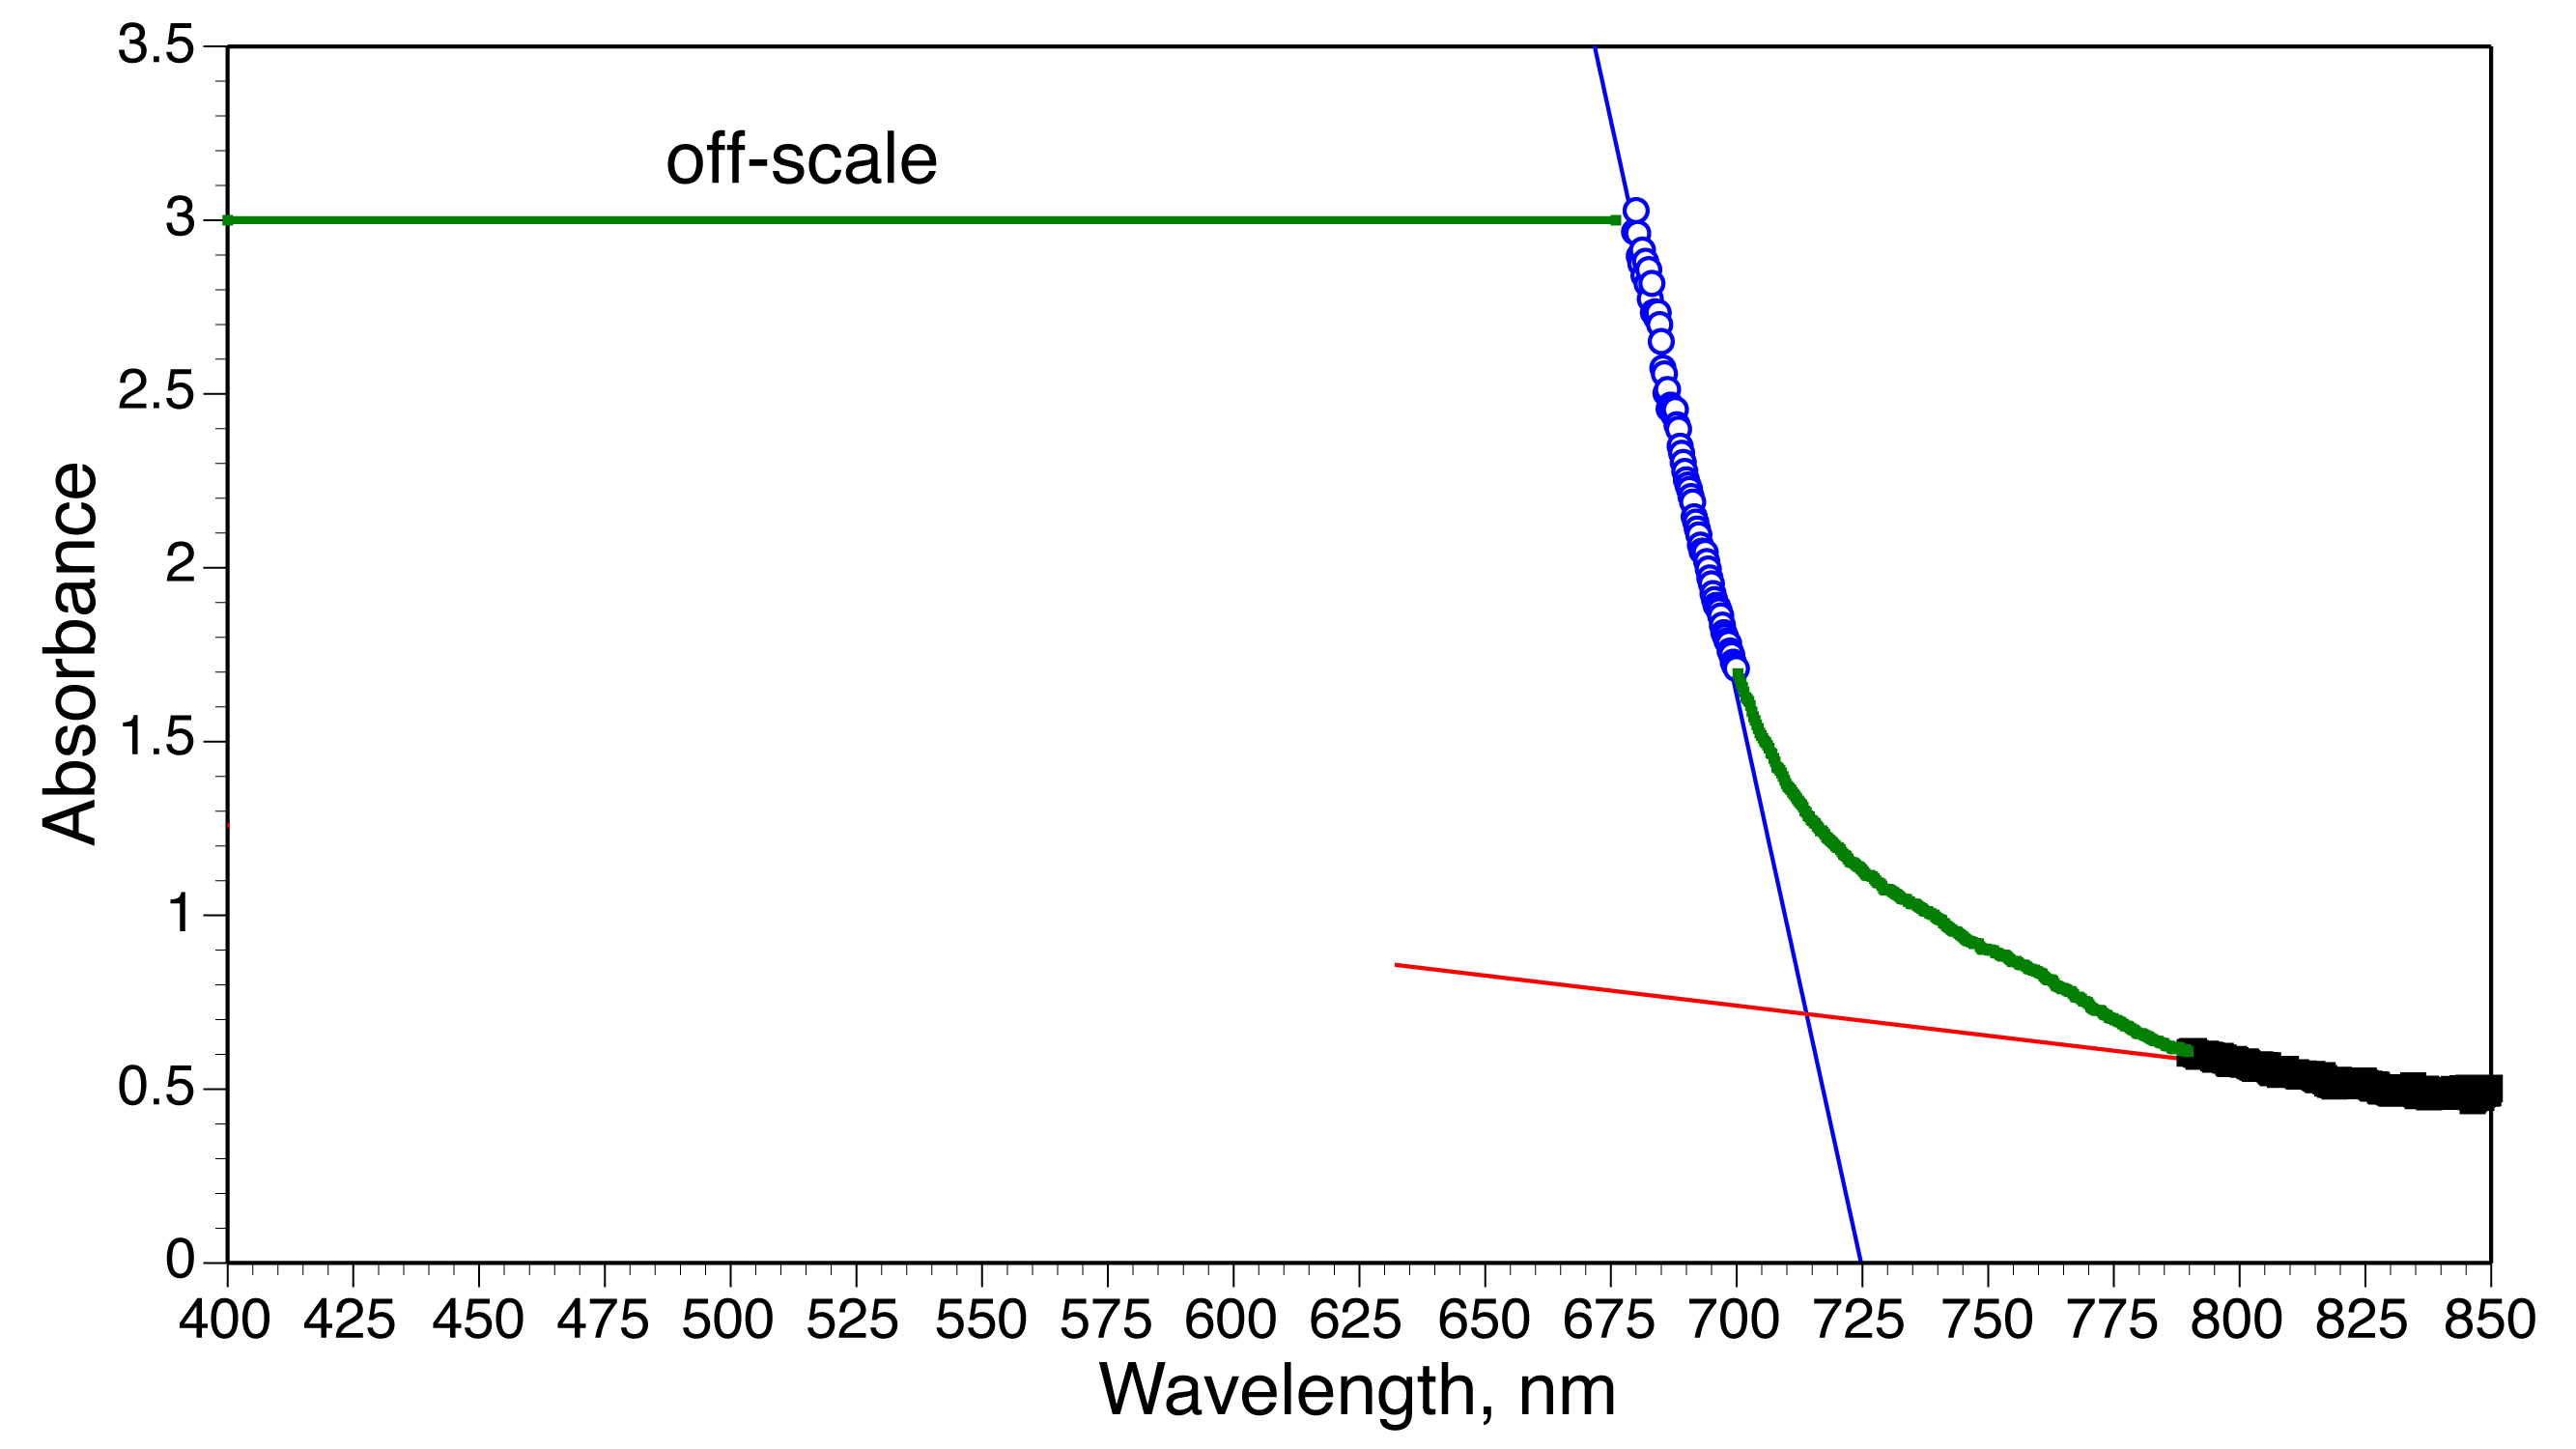 Visible spectrum extrapolation
Cleanup
Do not rinse with water or you will get an insoluble precipitate. When finished with the spectroscopy, return the labeled glass pieces. Wash your hands with hot water before leaving the lab.
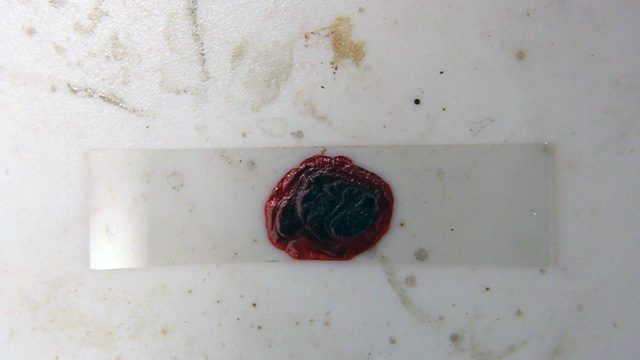
- Summarize your observations for any step that changes color. Why is the solid a different color than the solution?
- What happens to the diffraction angle, 2θ, as x increases? Why? Connect the results from this experiment with your results using optical transforms.
- Plot unit cell size as a function of x. What happens to the unit cell size when x gets bigger? Why? Explain using periodic properties.
- Plot band gap energy as a function of x. What happens to the band gap energy when x gets bigger? Why? Explain using periodic properties.
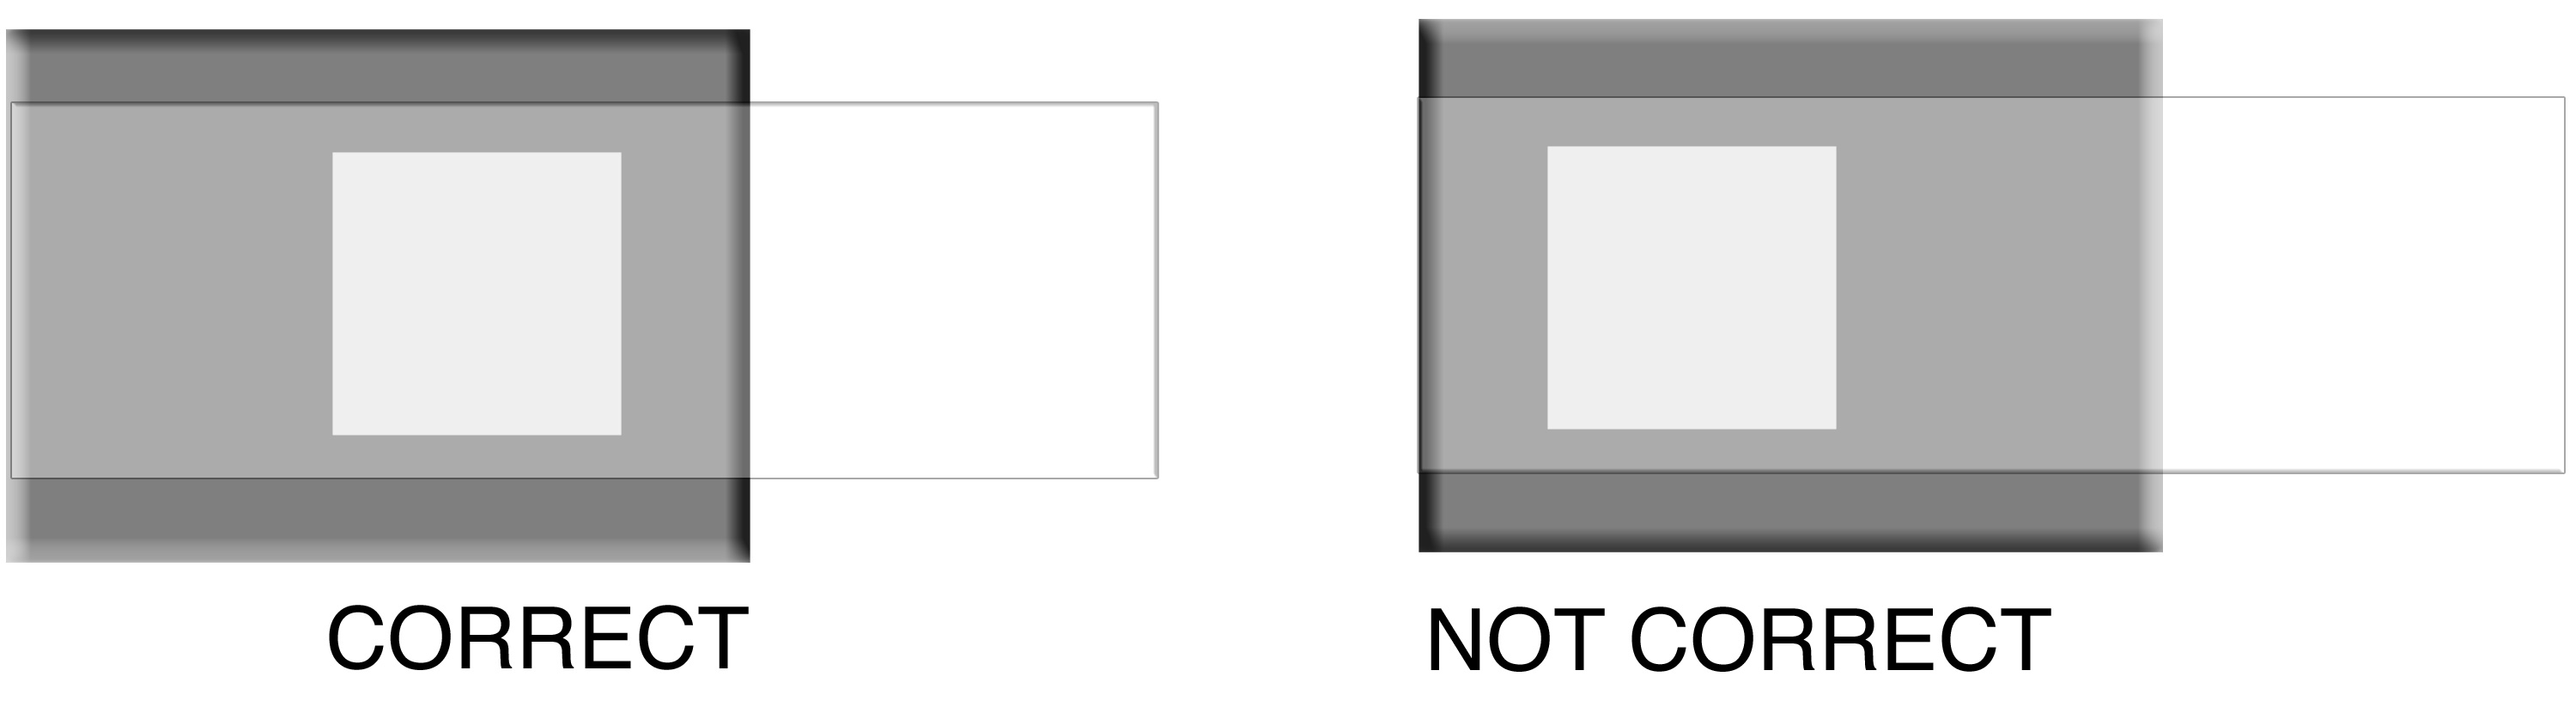
- glass microscope slides, standard 25 x 75 mm
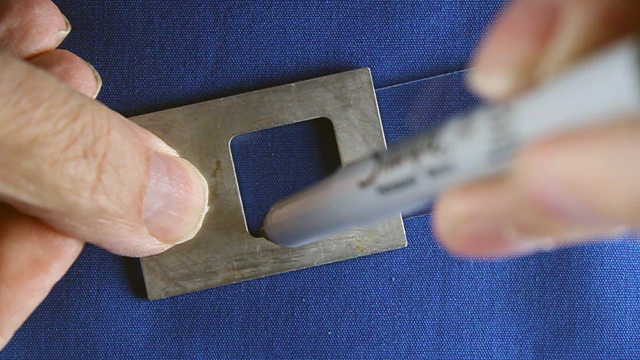
- aluminum XRD sample holders and markers
- 6-inch glass Pasteur pipets
- hotplates (Heat settings for samples in the center of the hotplate: Corning 190, Cimarec 160. Higher settings will be needed if the sample is placed on the edge of the hotplate.)
- microscope cover slips, 22x40mm, Corning 2940-224
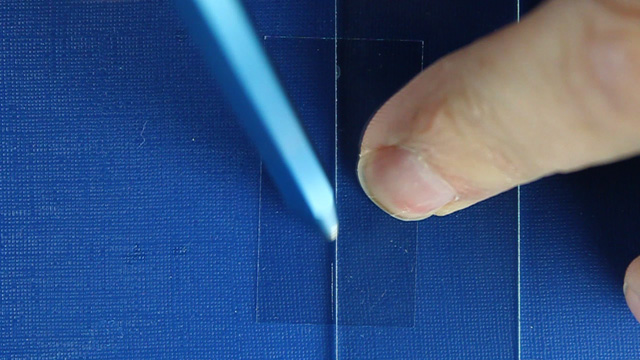
- diamond tipped pencil
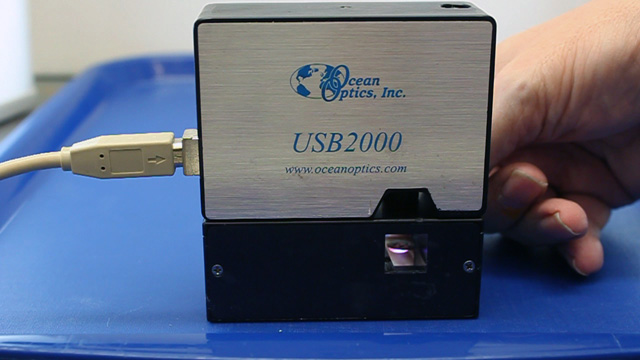
- visible spectrometer
- x-ray powder diffractometer (XRD)
Stock Solutions
- Dissolve 0.61g PbBr2 and 0.18g CH3NH3Br in 3 mL dimethylformamide (DMF) with stirring to give a clear 0.55 M stock solution of CH3NH3PbBr3.
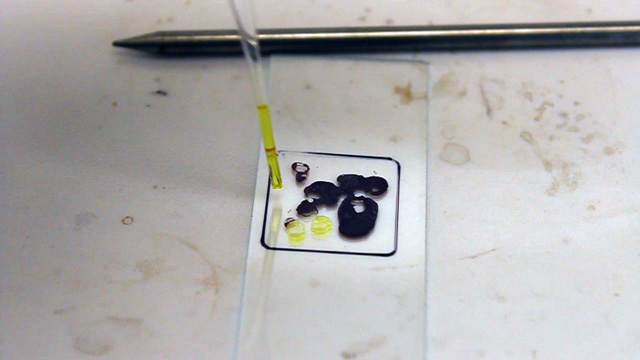
- Dissolve 0.76g PbI2 and 0.26g CH3NH3I in 3 mL dimethylformamide (DMF) with stirring to give a yellow 0.55 M stock solution of CH3NH3PbI3.
- Prepare the series of CH3NH3Pb(I1‑xBrx)3 solutions from the 0.55 M stock solutions:
Two adjustable micropipettes (one for each stock solution) minimizes tip usage. Store the solutions in capped labelled vials. Each solution is enough to prepare 5 samples.x (CH3NH3)PbI3 (CH3NH3)PbBr3 1.00 0 µL 250 µL 0.90 25 µL 225 µL 0.80 50 µL 200 µL 0.70 75 µL 175 µL 0.60 100 µL 150 µL 0.50 125 µL 125 µL 0.40 150 µL 100 µL 0.30 175 µL 75 µL 0.20 200 µL 50 µL 0.10 225 µL 25 µL 0.00 250 µL 0 µL
Preparation of solids used to make the stock solutions
- 7.45 g Pb(NO3)2 were dissolved in 50 mL water to make a 0.45 M solution.
- 3.74 g KI were dissolved in 50 mL water to make a 0.45 M solution.
- 2.68 g KBr were dissolved in 50 mL water to make a 0.45 M solution.
- 50 mL of 0.45 M KI were mixed with 25 mL of 0.45 M Pb(NO3)2. The yellow precipitate was isolated by filtration and washed with cold water. Yield: 3.89 g PbI2.
- 50 mL of 0.45 M KBr were mixed with 25 mL of 0.45 M Pb(NO3)2. The white precipitate was isolated by filtration and washed with cold water. Yield: 3.06 g PbBr2.
- 44 mL HBr (48% in water) was placed in a 250-mL round-bottom flask in an ice bath and stirred with a magnetic stirrer. 28 mL CH3NH2 (40% in water) was added gradually. The flask was then rotory evaporated at 70ºC for 2 hours to remove water and leave behind yellowish crystals. After filtration and washing with 100% cold ethanol, 26.88g of colorless crystalline solid CH3NH3Br was obtained, 75% yield.
- 50 mL HI (55% in water) was placed in a 250-mL round-bottom flask in an ice bath and stirred with a magnetic stirrer. 27.4 mL CH3NH2 (40% in water) was added gradually. The flask was then rotory evaporated at 70ºC for 2 hours to remove water and leave behind dark crystals. After filtration and washing with 100% cold ethanol, 29.92g of colorless crystalline solid CH3NH3Br was obtained, 64% yield.