
| Click molecule to rotate |
Concentration Units* Click image for graphs |
Ozone Depleting Potential** |
Atmospheric lifetime (years)** |
|
|---|---|---|---|---|
| Carbon dioxide CO2 |
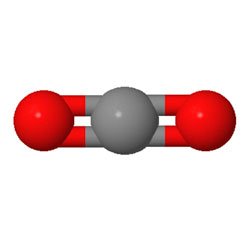 |
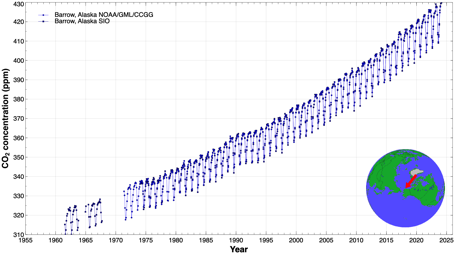 ppm 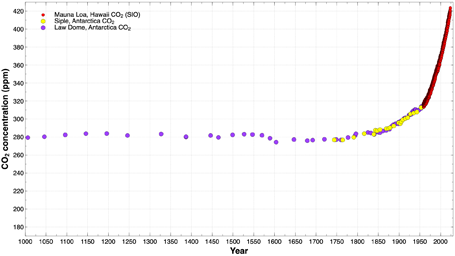 long term |
0 |
300-1000*** |
| Methane CH4 |
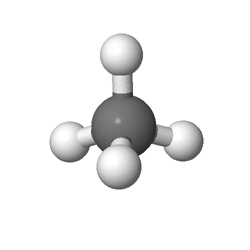 |
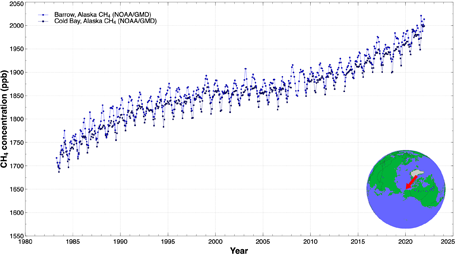 ppb 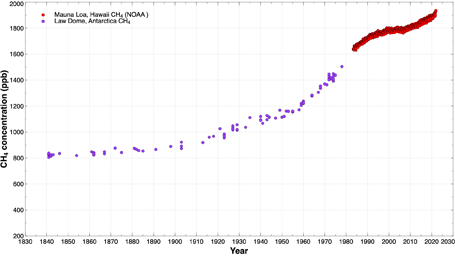 long term |
0 |
11.8 |
| Nitrous oxide N2O |
 |
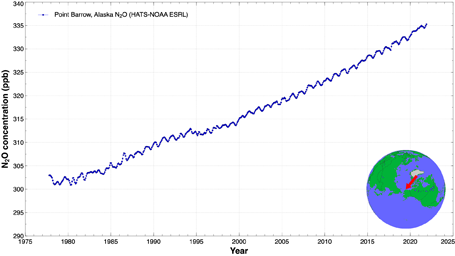 ppb 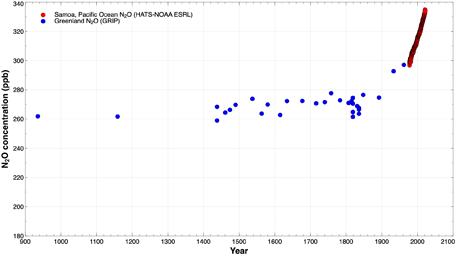 long term |
0.017 |
109 |
| Ozone O3 |
 |
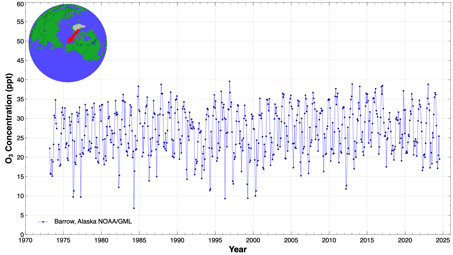 ppb 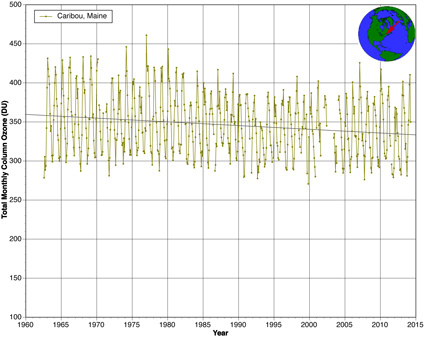 Total column (Dobson) |
hours-days |
|
| Hydrogen H2 |
 |
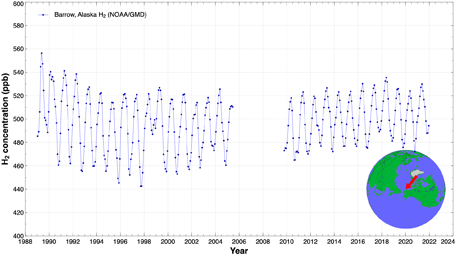 ppb |
0 |
1-2 |
| Carbon monoxide CO |
 |
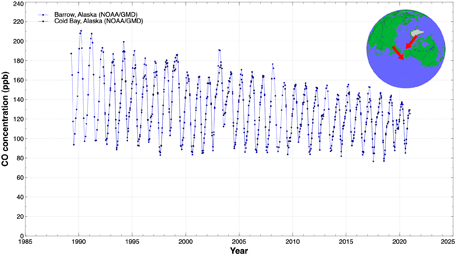 ppb |
0 |
0.25 |
| Trichlorofluoromethane CCl3F CFC-11 |
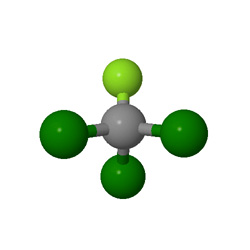 |
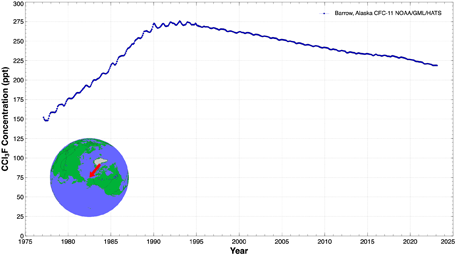 ppt |
1 |
52 |
| Dichlorodifluoromethane CCl2F2 CFC-12 |
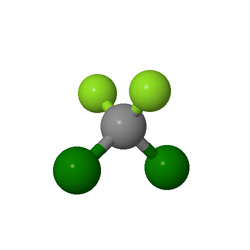 |
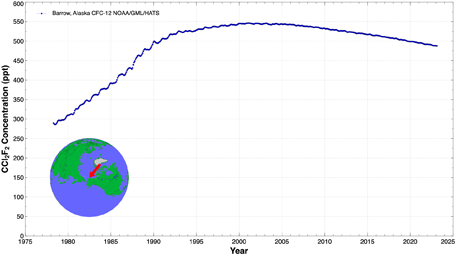 ppt |
0.75 |
102 |
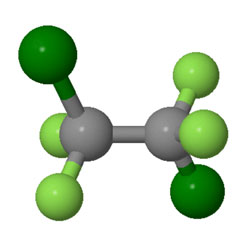
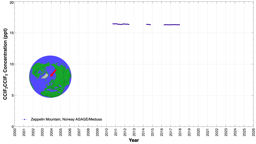
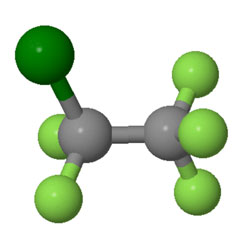
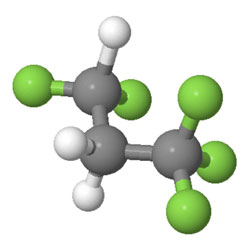
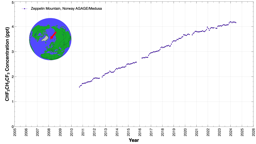
| 1,1,2-Trichloro-1,2,2-trifluoroethane CCl2FCClF2 CFC-113 |
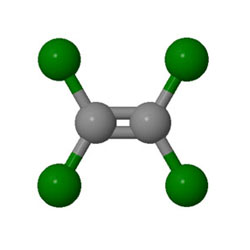 |
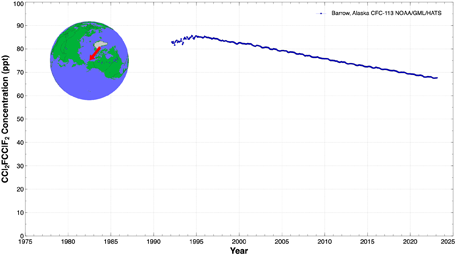 ppt |
0.82 |
93 |
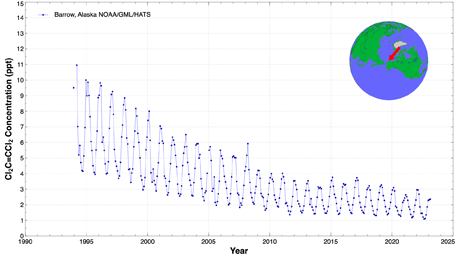
| Carbon tetrachloride CCl4 R-10 |
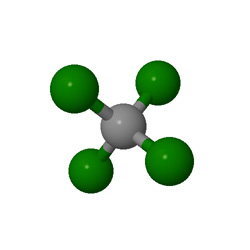 |
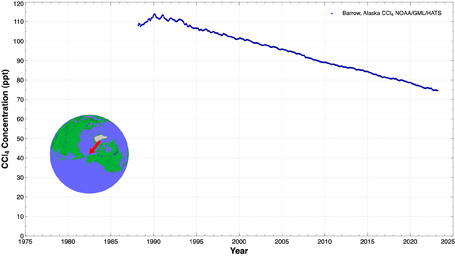 ppt |
0.87 |
32 |
| Carbon tetrafluoride CF4 PFC-14 |
 |
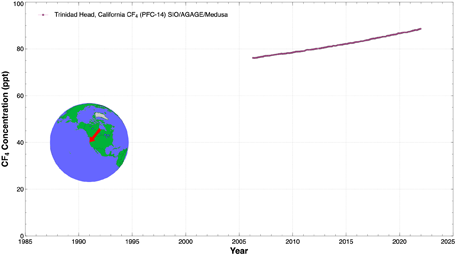 ppt |
0 |
50,000 |
| Chloroform CHCl3 R-20 |
 |
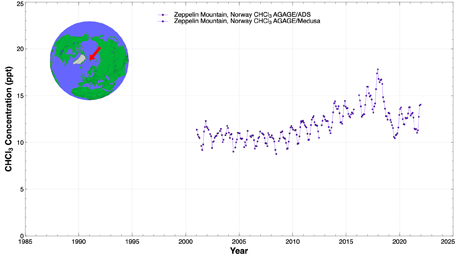 ppt |
0.01 |
0.501 |
| Chlorodifluoromethane CHClF2 HCFC-22 |
 |
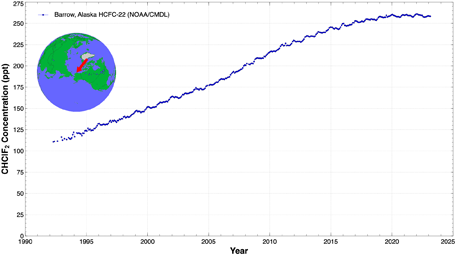 ppt |
0.038 |
11.6 |
| Fluoroform CHF3 HFC-23 |
 |
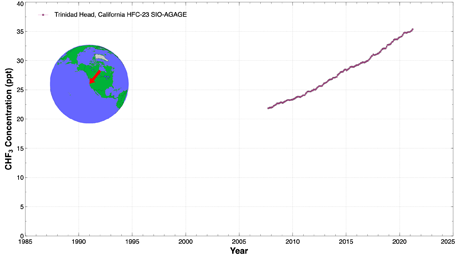 ppt |
0 |
228 |
| Dichloromethane CH2Cl2 R-30 |
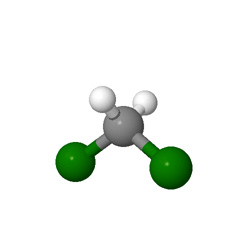 |
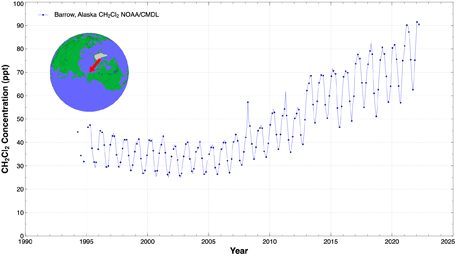 ppt |
0.004 |
0.493 |
| Difluoromethane CH2F2 HFC-32 50% of R-410A |
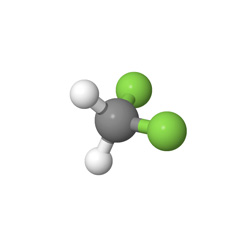 |
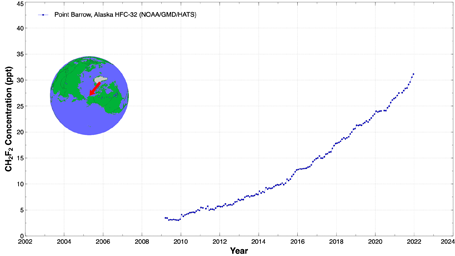 ppt |
0 |
5.4 |
| Methyl chloride CH3Cl Chloromethane R-40 |
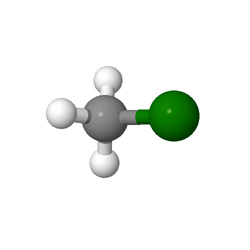 |
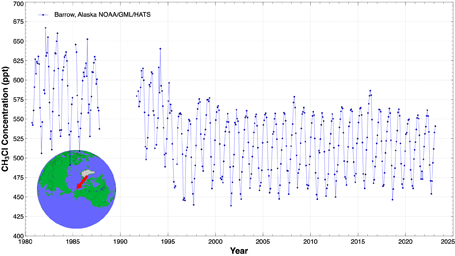 ppt |
0.015 |
0.9 |
| Methyl bromide CH3Br Bromomethane |
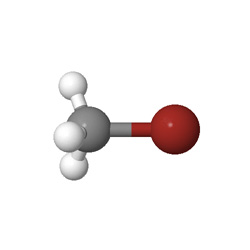 |
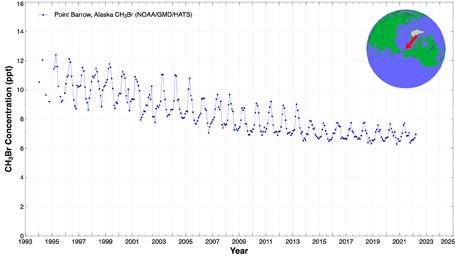 ppt |
0.66 |
0.8 |
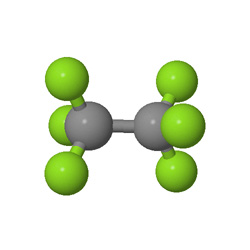
| 1,2-Dichloro-1,1,2,2-tetrafluoroethane CClF2CClF2 CFC-114 |
 |
 ppt |
0.53 |
189 |
| Chloropentafluoroethane CClF2CF3 CFC-115 |
 |
 ppt |
0.45 |
540 |
| Hexafluoroethane CF3CF3 PFC-116 |
 |
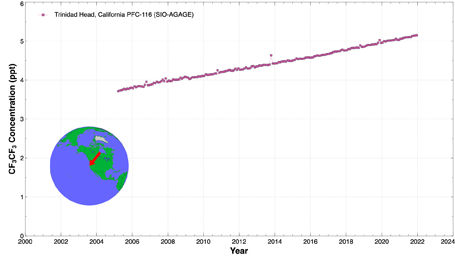 ppt |
0 |
10,000 |
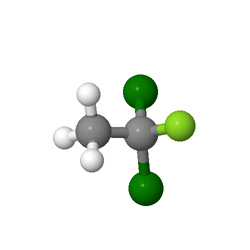
| Methyl chloroform CH3CCl3 1,1,1-Trichloroethane R-140a |
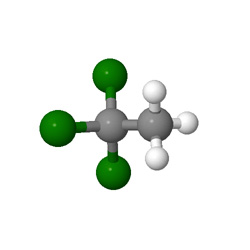 |
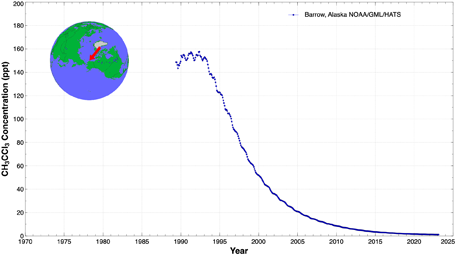 ppt |
0.12 |
5 |
| 1,1-Dichloro-1-fluoroethane CH3CFCl2 HCFC-141b |
 |
 ppt |
0.102 |
9.4 |
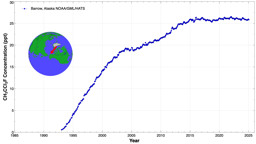
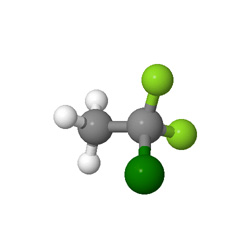
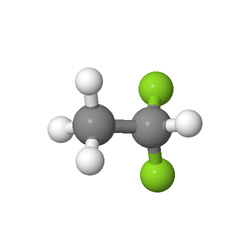
| 1-Chloro-1,1-difluoroethane CH3CClF2 HCFC-142b |
 |
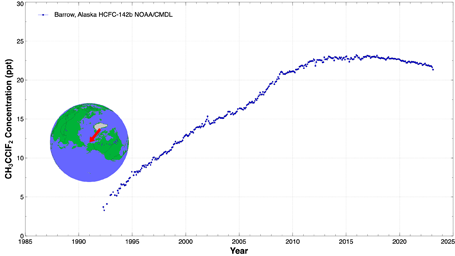 ppt |
0.057 |
17.1 |
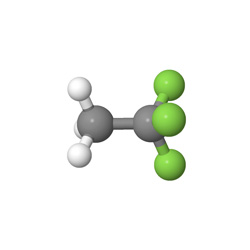
| 1,1-Difluoroethane CH3CHF2 HFC-152a |
 |
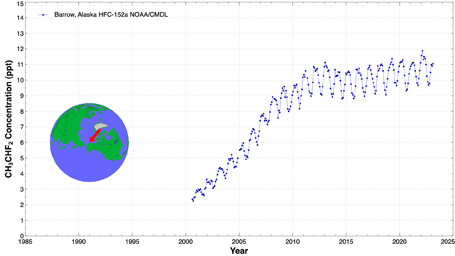 ppt |
0 |
1.6 |
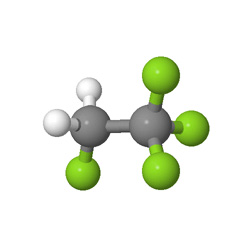
| 1,1,1-Trifluoroethane CH3CF3 HFC-143a |
 |
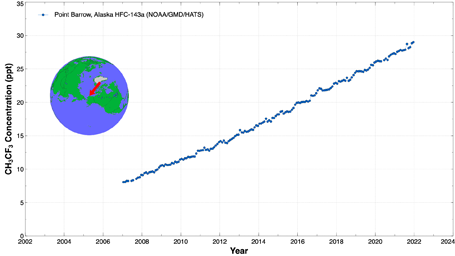 ppt |
0 |
51 |
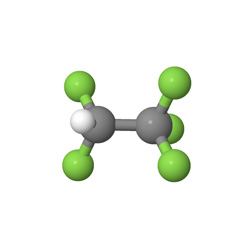
| 1,1,1,2-Tetrafluoroethane CH2FCF3 HFC-134a |
 |
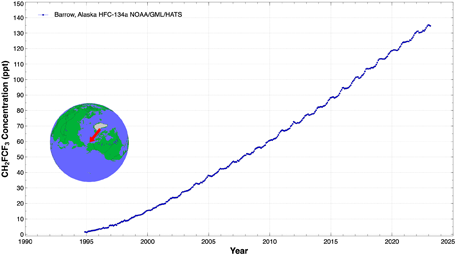 ppt |
0 |
14 |
| Pentafluoroethane CHF2CF3 HFC-125 50% of R-410A |
 |
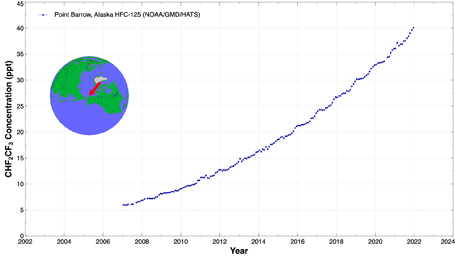 ppt |
0 |
30 |
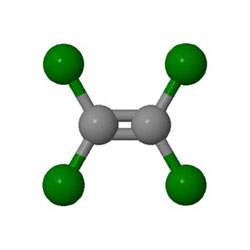
| Tetrachloroethene Cl2C=CCl2 Perchloroethylene |
 |
 ppt |
0.007 |
0.301 |
| Propane CH3CH2CH3 R-290 |
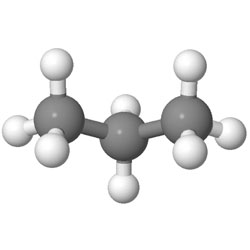 |
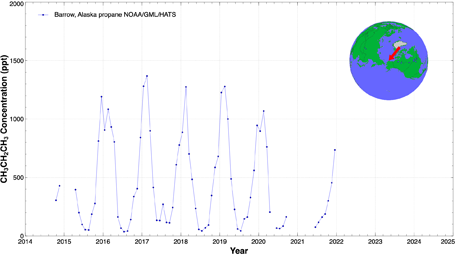 ppt |
0 |
0.036 |
| Sulfur hexafluoride SF6 |
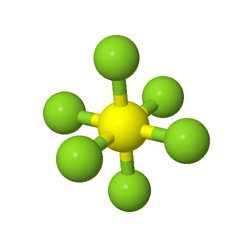 |
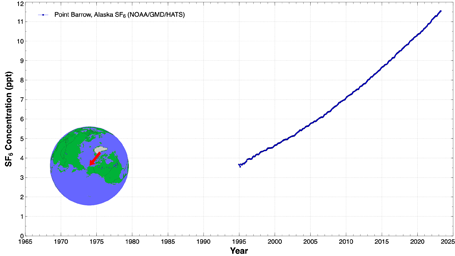 ppt |
0 |
1,000 |
|
Less than 5 ppt |
||||
| 1,1,1,3,3-Pentafluoropropane CHF2CH2CF3 HFC-245fa |
 |
 ppt |
0 |
7.9 |
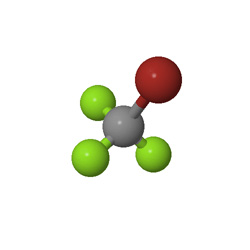
| Bromochlorodifluoromethane CBrClF2 Halon-1211 |
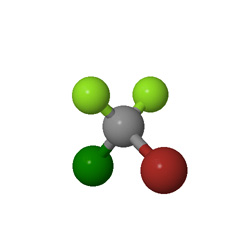 |
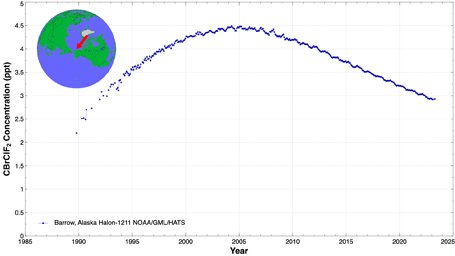 ppt |
7.1 |
16 |
| Nitrogen trifluoride NF3 |
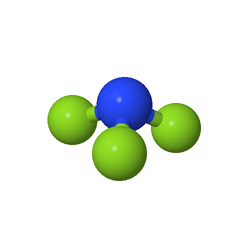 |
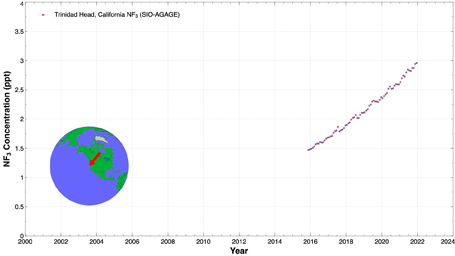 ppt |
0 |
569 |
| Bromotrifluoromethane CBrF3 Halon-1301 |
 |
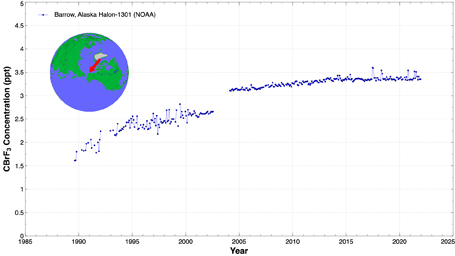 ppt |
17 |
72 |
| Chlorotrifluoromethane CClF3 CFC-13 |
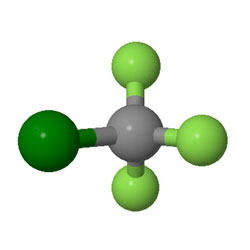 |
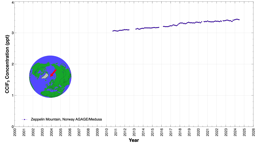 ppt |
0.3 |
640 |
| Sulfur dioxide difluoride SO2F2 |
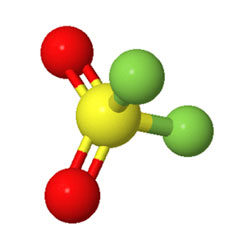 |
 ppt |
36 |
|
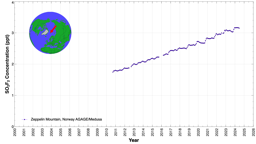
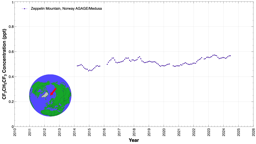
| 1,1,1,2,3,3,3- Heptafluoropropane CF3CFHCF3 HFC-227ea |
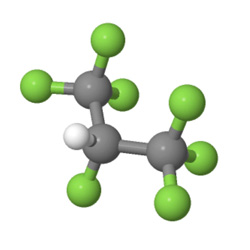 |
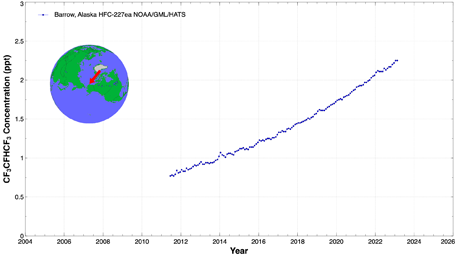 ppt |
0 |
36 |
| Perfluorocyclobutane C4F8 PFC-318 |
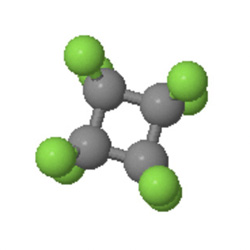 |
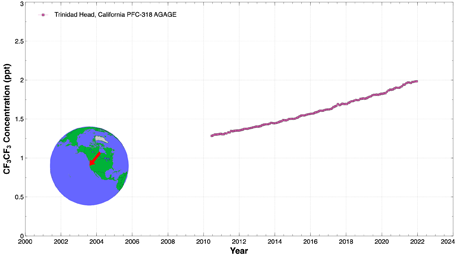 ppt |
0 |
3200 |
| 1,1,1,3,3-Pentafluorobutane CF3CH2CF2CH3 HFC-365mfc |
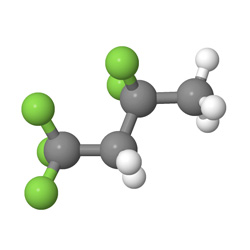 |
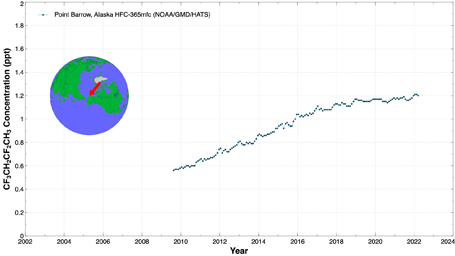 ppt |
0 |
8.9 |
| Perfluoropropane CF3CF2CF3 PFC-218 |
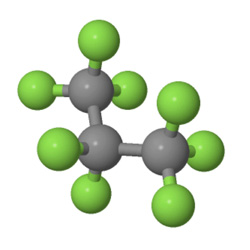 |
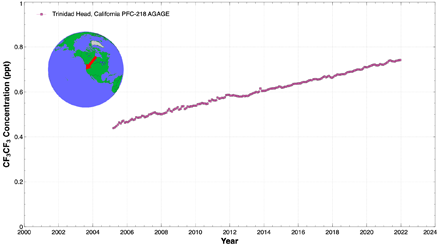 ppt |
0 |
2600 |
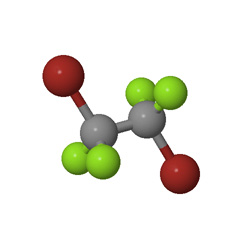
| 1,2-Dibromotetrafluoroethane CBrF2CBrF2 Halon-2402 |
 |
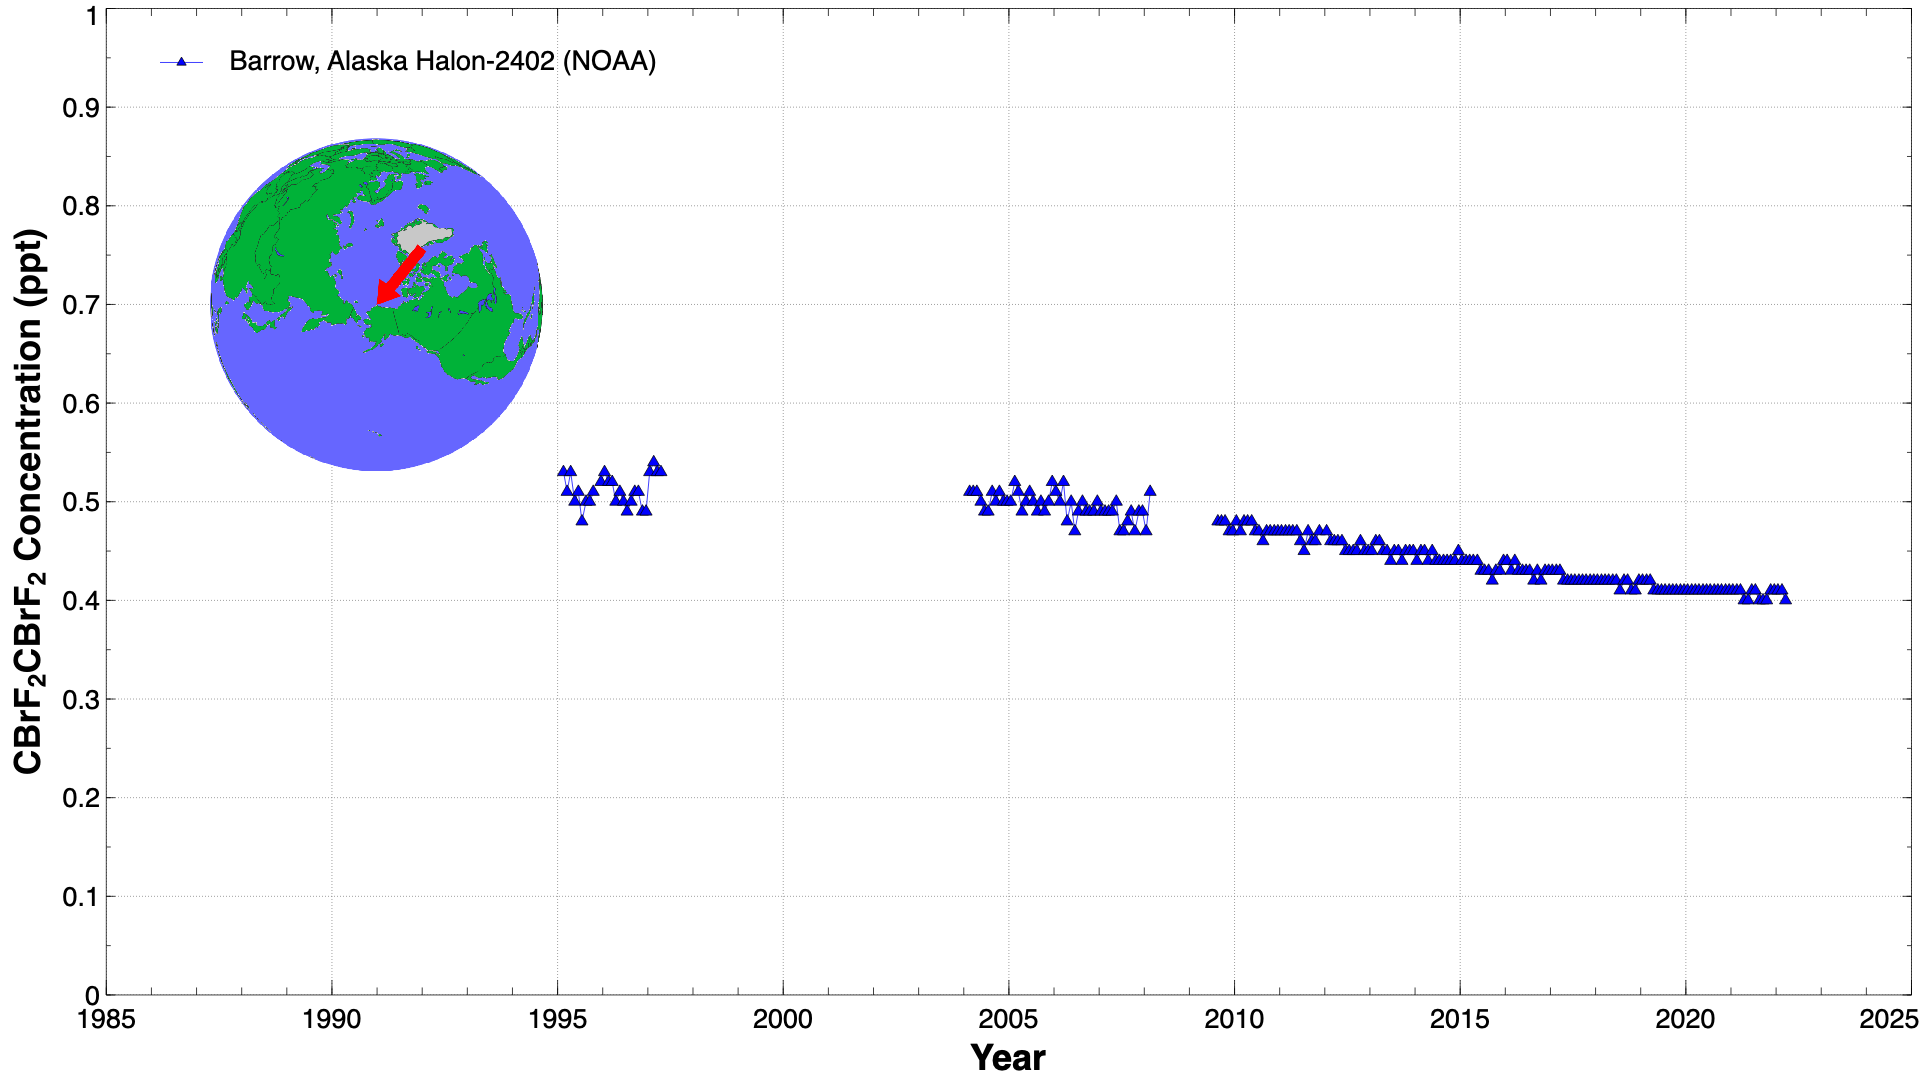 ppt |
15.7 |
28 |
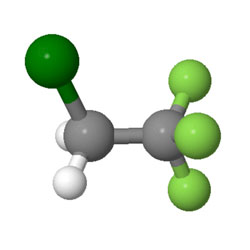
| 2-Chloro-1,1,1-trifluoroethane CH2ClCF3 HCFC-133a |
 |
 ppt |
0.019 |
4.6 |
| 1,1,1,3,3,3-Hexafluoropropane CF3CH2CF3 HFC-236fa |
 |
 ppt |
0 |
213 |
| 1,2-Dichloro-1,1-difluoroethane CH2ClCClF2 HCFC-132b |
 |
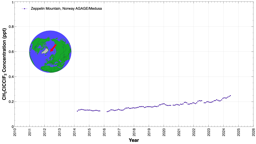 ppt |
0.038 |
3.5 |
| 1,1,1,2,2,3,4,5,5,5-Decafluoropentane CF3CHFCHFCF2CF3 HFC-4310mee |
 |
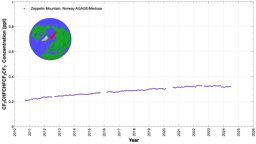 ppt |
0 |
17 |
| 2,3,3,3-Tetrafluoropropene CF3CF=CH2 HFO-1234yf |
 |
<1 ppt (decomposes to CF3COOH) |
0 |
0.033 |
| Trifluoromethyl sulfur pentafluoride CF3SF5 |
 |
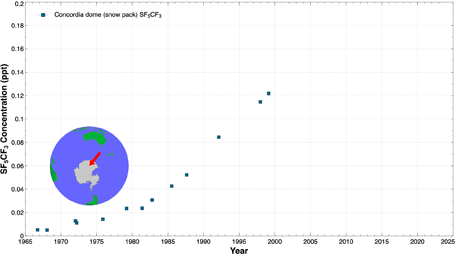 ppt |
0 |
800 |
Information about Sampling Sites.
*Concentration data from the Scripps CO2 Program,
the Advanced Global Atmospheric Gases Experiment (NASA),
Global Greenhouse Gas Reference Network and Long-term global trends of atmospheric trace gases (Global Monitoring Laboratory, U. S. National Oceanic and Atmospheric Administration),
Cape Grim Australia Greenhouse Gas Data (CSIRO),
and the World Data Centre for Greenhouse Gases (Japan Meteorological Agency and the World Meteorological Organization).
**The Ozone Depletion Potential (ODP) is used to contrast different gases and provides a simple measure
of the expected impact on ozone per unit mass emission of a gas relative to that caused by CFC-11 defined as 1.
Atmospheric lifetime is used to characterize the decay of an instanenous pulse input to the atmosphere,
and represents the time the input would take to decay to 0.368 (1/e) of its original value.
ODP values from World Meteorological Organization,
Scientific Assessment of Ozone Depletion: 2018, Table A-1 and
United States Environmental Protection Agency, Ozone-Depleting Substances.
Atmospheric lifetimes taken from Intergovernmental Panel on Climate Change, Climate Change 2021:
The Physical Science Basis, Table 7.SM.6, p. 16-27.
***IPCC no longer lists a value for the carbon dioxide lifetime. It depends on the biosphere and concentration-dependent equilibria between the atmosphere, the ocean, and deposition of CaCO3 on timescales of a few centuries.
See Annu. Rev. Earth Planet. Sci. 37:117-34 (2009) and The Atmosphere: Getting a Handle on Carbon Dioxide (NASA 2019).
Earlier versions of these pages were supported by the National Science Foundation grants DUE-9455918 and DUE-9455924.
This page created by George Lisensky, Beloit College. Last modified July 25, 2025.