 |
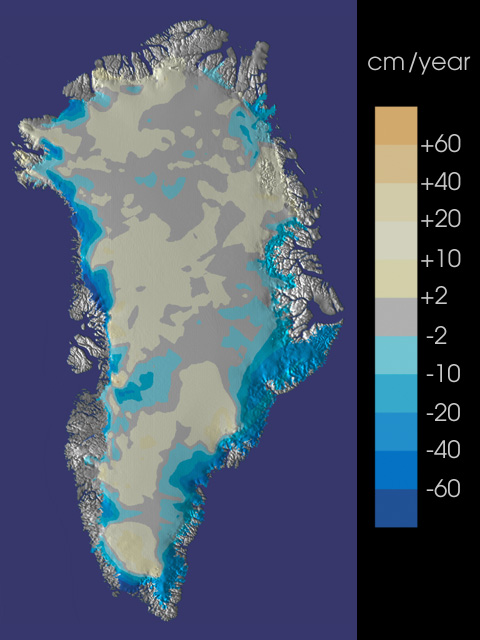
Greenland's
Receeding Ice
July 2000, 8.4 MB
Less ice, more ocean. That's the troubling conclusion emerging from
new NASA research to study the condition of Greenland's ice sheet. Using
a laser altimeter repeatedly flown across the surface of Greenland,
experts say the edges of the ice found there may be thinning at the
rate of nearly one meter per year.
http://svs.gsfc.nasa.gov/imagewall/greenland.html |
|
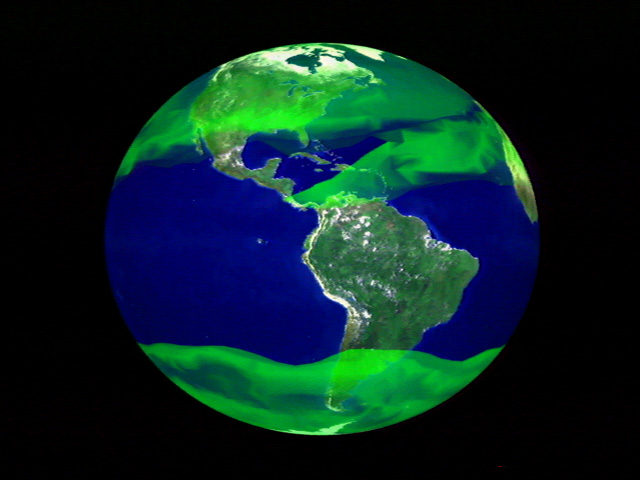
More than
Just Carbon Dioxide
January 2002, 2.4 MB
Methane: a simple compound made of carbon and hydrogen, this gas comes
from ordinary sources, like cattle herds and garbage dumps. On a planetary
scale it also has a significant impact on climate. As it builds up in
the atmosphere, it traps energy from the sun like a layer of insulation.
http://www.gsfc.nasa.gov/topstory/20020103greenhouse.html
|
|
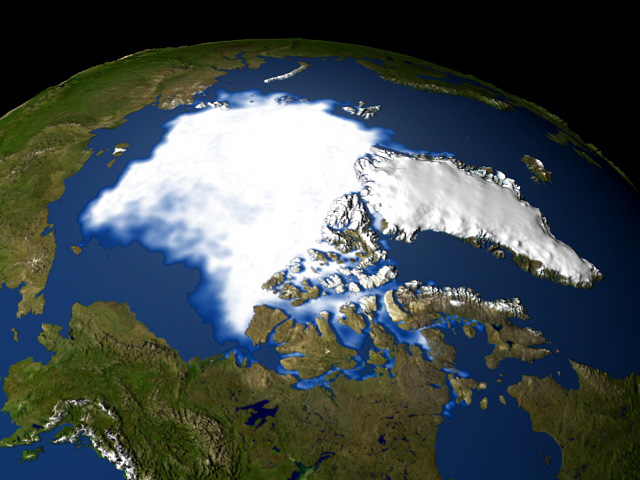
Evidence
of Arctic Warming Grows
October 2003, 3.6 MB
Recently observed change in Arctic temperatures and sea ice cover may
be a harbinger of global climate changes to come. Satellite data are
allowing researchers to more clearly see Arctic changes and develop
an improved understanding of the possible effect on climate worldwide.
http://www.gsfc.nasa.gov/topstory/2003/1023esuice.html |
|
Arctic Sea Ice Minimum Concentration
October 2006, 8 MB
This animation shows the annual minimum Arctic sea ice extent and concentration from 1979 to 2006.
Average climatology from 1979 to 2004 is shown as a yellow outline.
http://svs.gsfc.nasa.gov/goto?3378 |
|
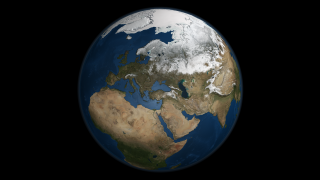
Global Rotation with Seasonal Landcover
February 2007, 8 MB
This animation shows seasonal changes in landcover and Arctic sea ice from 2005-09-21 through 2006-09-20.
http://svs.gsfc.nasa.gov/goto?3404 |
|
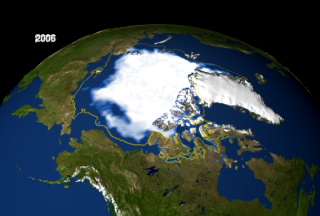
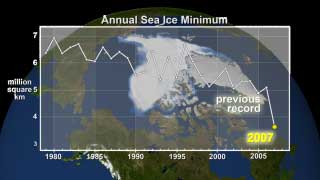
'Remarkable' Drop in Arctic Sea Ice Raises Questions
September 2007, 12.9 MB
The area of the perennial ice has been steadily decreasing since the satellite record began in 1979, at a rate of
about 10% per decade. But the 2007 minimum, reached around Sept. 14, is far below the previous record made in 2005
and is about 38% lower than the climatological average. This data visualization shows the annual sea ice minimum from 1979 through 2007.
http://www.nasa.gov/centers/goddard/news/topstory/2007/arctic_minimum.html |