These curves show the titration of Cd+2 ion (analyte
in flask) with EDTA-4 (titrant in buret) in the presence
of NH3 and NH4+ (pH buffer).
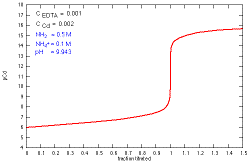 How does a titration curve change when the concentration
of Cd+2 is changed?
|
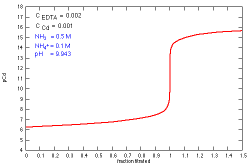 How does a titration curve change when the concentration
of EDTA is changed?
|
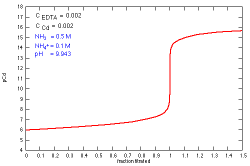 How does a titration curve change when the concentration
of both EDTA and Cd+2 is changed?
|
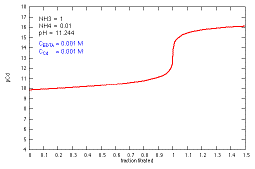 How does a titration curve change when the pH (NH4+
concentration) is changed?
|
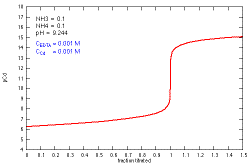 How does a titration curve change when the buffer
concentration (both NH3 and NH4+)
is changed?
|
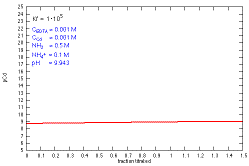 How does a titration curve change when Kf is changed?
|


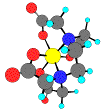
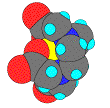 Models of EDTA and M EDTA
|
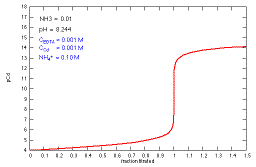 How does a titration curve change when the NH3
concentration (buffer complexation and pH) is changed?
|