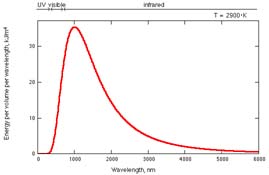
These are wavelength plots. Energy increases
towards the left.
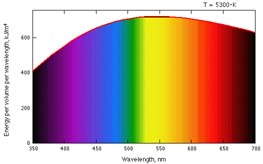
The curves for the visible portion of the spectrum are colored
with the approximate color for each wavelength.
The observed color depends on the sum of the colors and their
intensity. See color mixing.
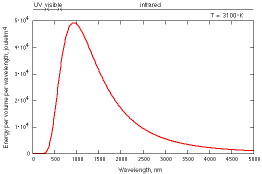 Blackbody emission from 1500 to 3100 K.
|
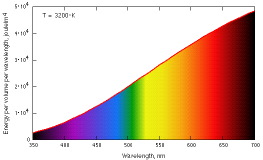 Visible portion of blackbody emission from 2500 to
3200 K.
Visible portion of blackbody emission from 2500 to
3200 K.
|
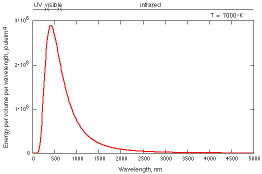 Blackbody emission from 3000 to 7000 K.
|
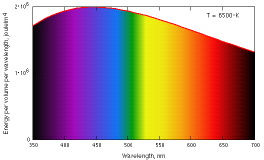 Visible portion of blackbody emission from 3000 to
6500 K.
Visible portion of blackbody emission from 3000 to
6500 K.
|
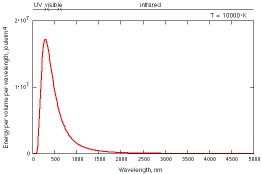 Blackbody emission from 6000 to 10,000 K.
|
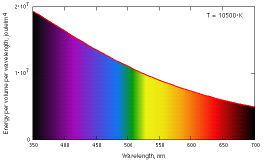 Visible portion of blackbody emission from 6000 to
10,500 K.
Visible portion of blackbody emission from 6000 to
10,500 K.
|
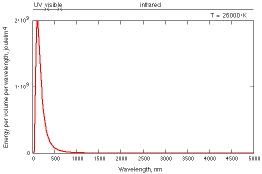 Blackbody emission from 10,000 to 26,000 K.
|
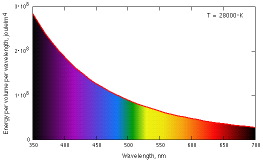 Visible portion of blackbody emission from 10,000
to 28,000 K.
Visible portion of blackbody emission from 10,000
to 28,000 K.
|
 Blackbody emission from 500 to 9600 K. Note that the
vertical scale constantly changes.
Blackbody emission from 500 to 9600 K. Note that the
vertical scale constantly changes.
|
 Visible portion of blackbody emission from 500 to
9500 K. Note that the vertical scale constantly changes.
Visible portion of blackbody emission from 500 to
9500 K. Note that the vertical scale constantly changes.
|